
Masae Hosoda
I majored in bioinformatics at the Graduate School of Engineering, Soka University. Since obtaining a PhD in 2019 under Professor Kiyoko Kinoshita, I have been engaged in education and research as an Assistant Professor at Soka University. We are currently studying multiple alignment of glycan structures and developing MCAW tools and MCAW-DB. I also participate in the GlyCosmos project of Professor Kinoshita.

Kiyohiko Angata
Graduated from the Institute of Biological Sciences at University of Tsukuba, Trained and learned glycobiology under the supervision of Dr. Minoru Fukuda at La Jolla Cancer Research Foundation (current Sanford Burnham Prebys Medical Discovery Institute). Research topics are profiling of glycogene expression, analysis and application of new function of glycans, and development of glyco-DB (ACGG-DB).
In the fourth part of this series, databases (DBs) related to lectins are described. Generally, molecules that bind to glycans are called “lectins.” Lectins present in plants have been studied for a long time in biology, and are also used as a tool for investigating cells and glycans as well as for studying their physiological activities. In animal cells and in vivo, lectins such as “galectin” and “calnexin” play important roles as functional molecules that bind to glycans. Various organisms, ranging from bacteria to plants and animals, have many molecules with lectin-like activities, although most of those molecules are not known as lectins. Here, we will introduce various lectins useful for glycan research, and DBs that summarize their activities (LfDB, LM-GlycomeAtlas, MCAW-DB, and GlyCosmos Lectins).
An important theme for understanding the function of glycans involves the interactions between glycans and their binding molecules (lectins). Glycans serve as targets for lectins involved in the quality control of protein modification processes, and also in the regulation of binding between molecules or cells on the cell membrane. In an animal body, glycans and glycan-binding molecules are also deeply involved in clearance of hormones and other substances from blood, as well as in cell migration of lymphocytes and the metastasis of cancer cells. Analysis of glycan-binding molecules (lectins) is becoming increasingly important. In addition, lectins contained in fungi and plant seeds are also known to act as blood coagulants or toxins, and they have been used as research tools because of their glycan-binding activity.
Various species of lectins, and some other molecules known to possess lectin-like activities are present in various organisms; however, few databases (DBs) describing lectins have been established. To search for lectin structures and sequences, the databases LectinDB, UniLectin, and GLYCO3D are currently available. Since lectins are also proteins, it is also possible to obtain information from UniProtKB, Protein Data Bank Japan, and others. DBs containing analysis results of lectin-glycan bindings are useful when conducting functional analysis. This is because lectins are molecules that can bind to various glycan structures; therefore, it is necessary to understand the differences in binding affinities among them when performing experiments with lectins. Other databases include the Lectin Frontier database (LfDB; detailed below), describing measurements of glycan-lectin binding by frontal affinity chromatography; the recently developed Lectin Microarray Glycome Atlas (LM-GlycomeAtlas), which contains results of lectin microarray analysis of mouse organs and the Multiple Carbohydrate Alignment with Weights database (MCAW-DB), which summarizes the results of glycan-binding activity measured by use of a glycan array.
Binding activities of molecules to glycans have been also reported for materials other than plant lectins and animal lectins (such as calnexin), and are called lectin-like activities. The number of known lectins plus lectin-like materials continues to increase year by year. For example, Siglecs have molecular structures that belong to the immunoglobulin superfamily and sialic acid-binding activity, and the polypeptide GalNAc transferase (ppGalNAcT) has a polypeptide with GalNAc- (O-Ser / Thr)-binding activity. Focusing on such lectin and lectin-like activities, the Lectin Frontier Database (LfDB, Hirabayashi et al. 2015) has been released as one of the Japan Consortium for Glycobiology & Glycotechnology Databases (JCGGDB). Currently, the latest version of the interface display method and description has been released within the Asian Community of Glycoscience and Glycotechnology (ACGG)*. Some of its features are described below.
The LfDB currently lists 398 lectins, which are arranged in alphabetical order, and displays information mainly about the characteristics of lectin binding to glycans (including monosaccharides) for each lectin, and search tools (Fig. 1). The results of glycan-lectin binding measured by frontal affinity chromatography can be seen for 75 lectins (Iwaki and Hirabayashi 2018). Both text and facet searching are available as search modes, to enable easy narrowing-down of searches. In faceted searches, the researcher can select from FAC Analysis Available, Pfam, Kingdom, and Monosaccharide Specificity data.
*Note that LfDB can be accessed not only from the ACGG portal, but also from that of the Japan Consortium Glycoscience and Glycotechnology (JCGG) and the GlyCosmos portal.
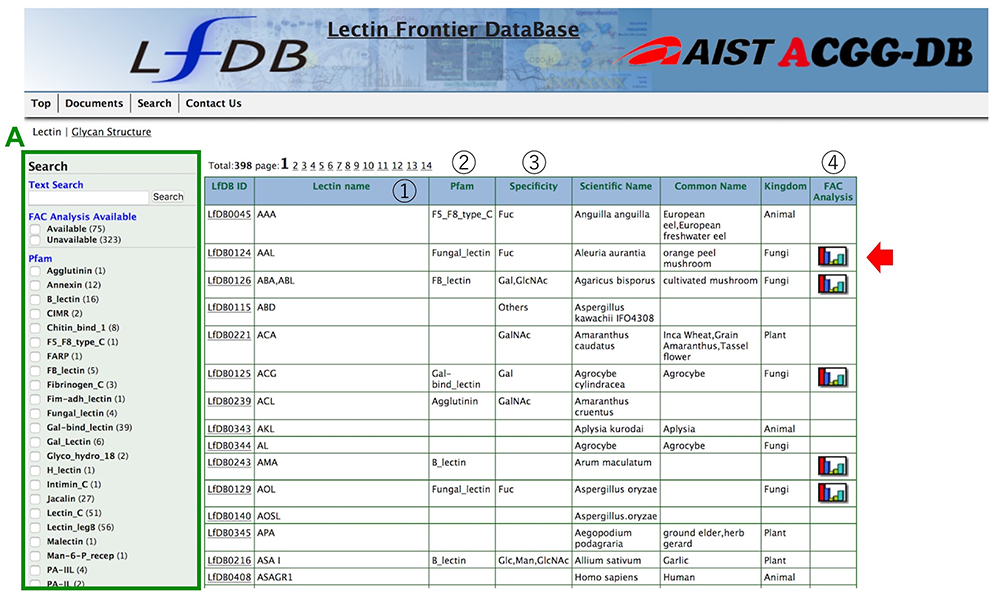
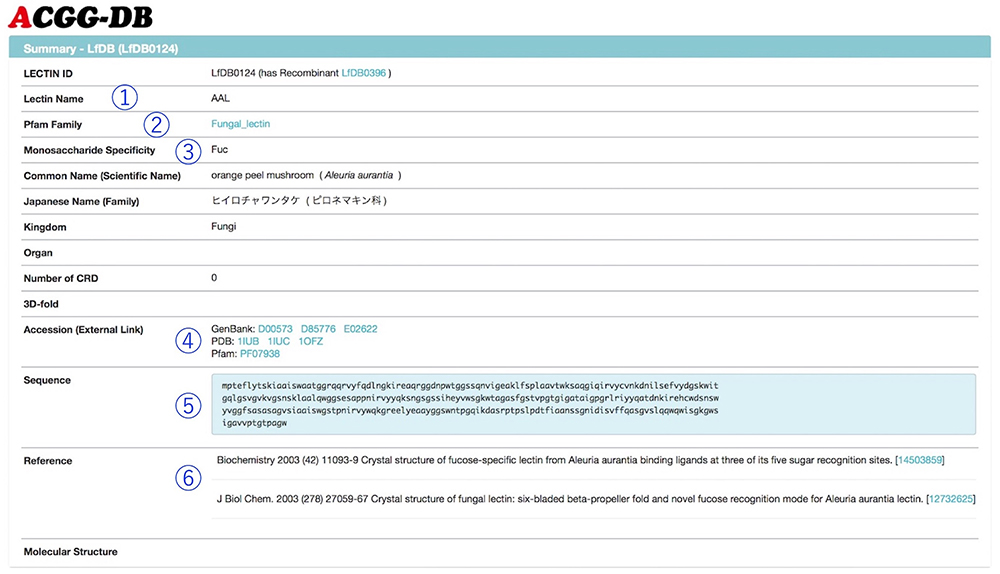
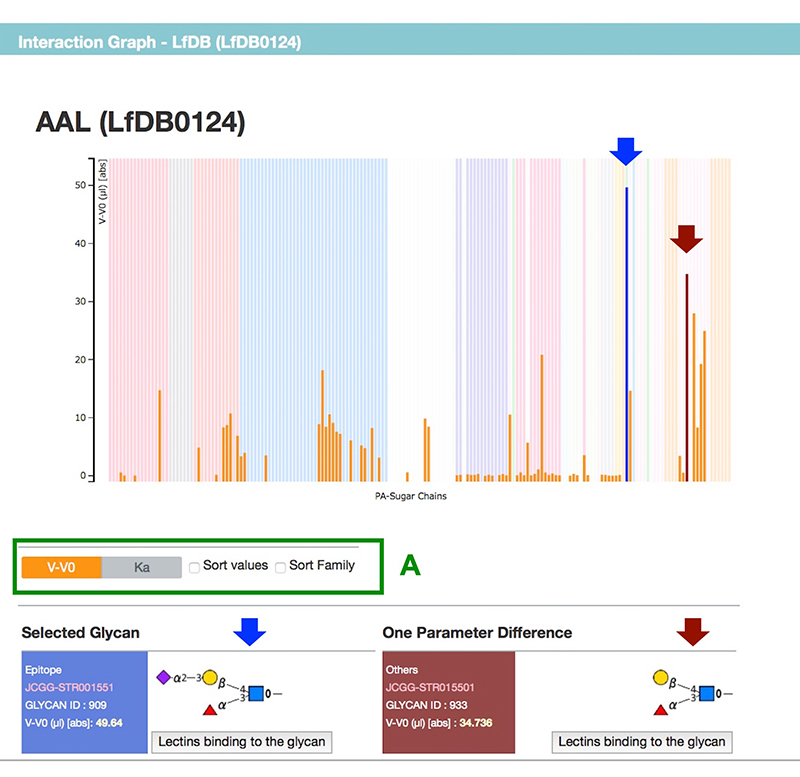
Figure 2 shows a summary page for a selected lectin. Each summary page includes links to GenBank and Pfam, and sequence information (The results of frontal affinity chromatography are shown in a graph, and the binding ability of lectin to each glycan is displayed as V-V0 or Ka value (Fig. 3). Hovering the mouse over any bar shows the respective glycan structure and binding activity. Furthermore, by clicking once, not only the selected glycan structure, but also a structure differing in only one area, are displayed below the graph. The difference in structure and lectin binding ability between these two glycans can be compared, which is useful for the interpretation of experiments using lectins.
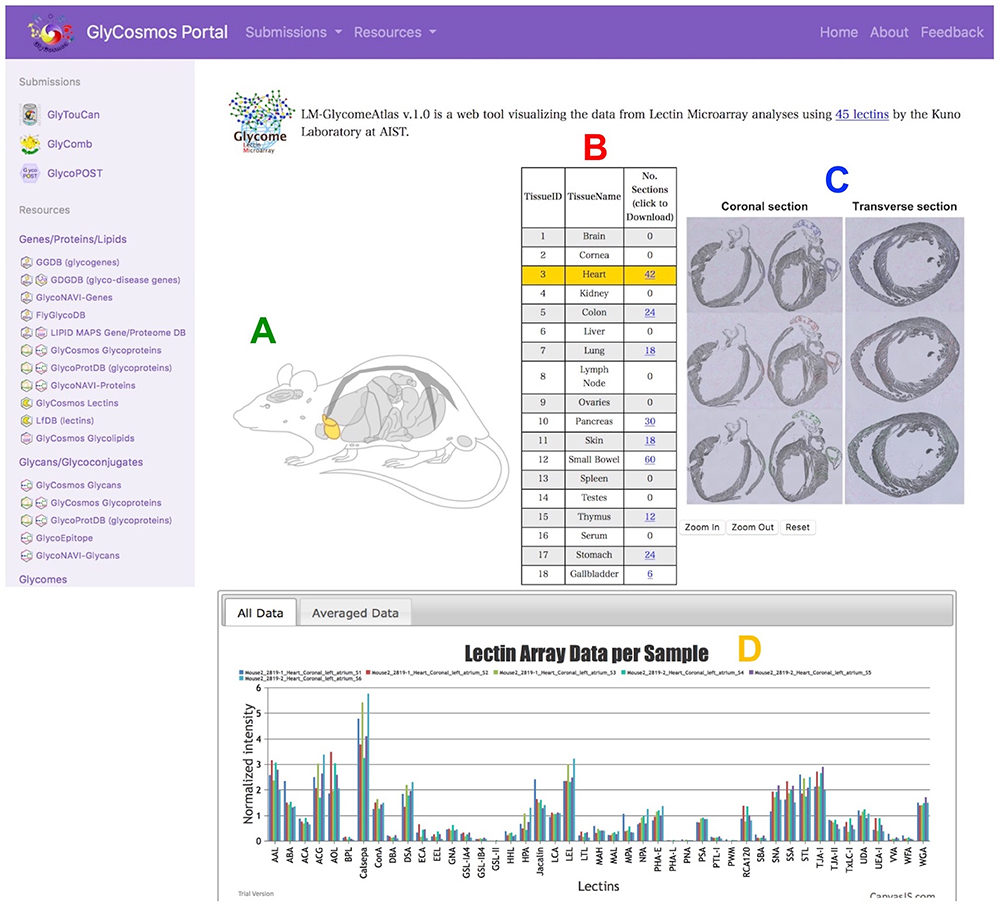
Lectin microarray technology, which has been developed to analyze lectins using lectin-spotted array slides (Kuno et al. 2005), enables estimation of glycan structures from small amounts of samples, and detection of the difference in glycans between samples in serum and cancer cells. The LM-GlycomeAtlas summarizes the results of lectin microarray analysis of glycoproteins extracted from slides of various mouse organs using the laser microdissection method (Nagai-Okatani et al. 2019). This DB is useful for comparing glycan structures expressed in various organs of normal mice, making it possible to ascertain the tendencies of organ-specific glycan structures.
When moving from the GlyCosmos Portal site to LM-GlycomeAtlas, the user can see a diagram of mouse histological features and a table containing 18 organs/tissues from which to select an organ/tissue of interest (currently 9). By selecting the organ/tissue name (TissueName), it is possible to display an image of a slide of the organ/tissue and view the image after laser microdissection of the sample, and to obtain preparation information of the glycoproteins in each sample. The results of lectin microarray of each mouse are also displayed in a graph so that the user can visually understand the results. Detailed information such as measurement results can also be downloaded from the column “No. Sections” in the table.
The Multiple Carbohydrate Alignment with Weights Database (MCAW-DB) (Hosoda et al. 2018) can be accessed from https://mcawdb.glycoinfo.org. This DB stores data from analysis of glycans recognized by glycan-binding proteins (GBPs), including lectins and antibodies, and data for a total of 1081 glycan alignments for which results of glycan array analysis experiments have been released. As for glycan alignment, a dynamic programming method using the MCAW tool (Hosoda et al. 2017) is used to calculate common sites from multiple glycan structures. Since comparative calculations are carried out to align the same monosaccharides and bonds of each glycan structure, the results analyzed using the MCAW tool can visualize the common sites among multiple glycan structures. The current release of the MCAW-DB provides the MCAW tool-analyzed data of glycan structures that exhibit a high Relative Fluorescence Units (RFU) value based on the glycan array experiment results of animals, plants, antibodies, viruses and antibodies published by Consortium for Functional Glycomics (CFG). With this database, the user can view the glycan patterns recognized by GBPs.
The MCAW-DB home screen displays a list of sample names and species for CFG glycan array experiment data analyzed with the MCAW tool, as shown in Figure 5. On the left side of the screen, there are filters for text searches for users to search for data and to narrow down the classification of tissues and proteins.
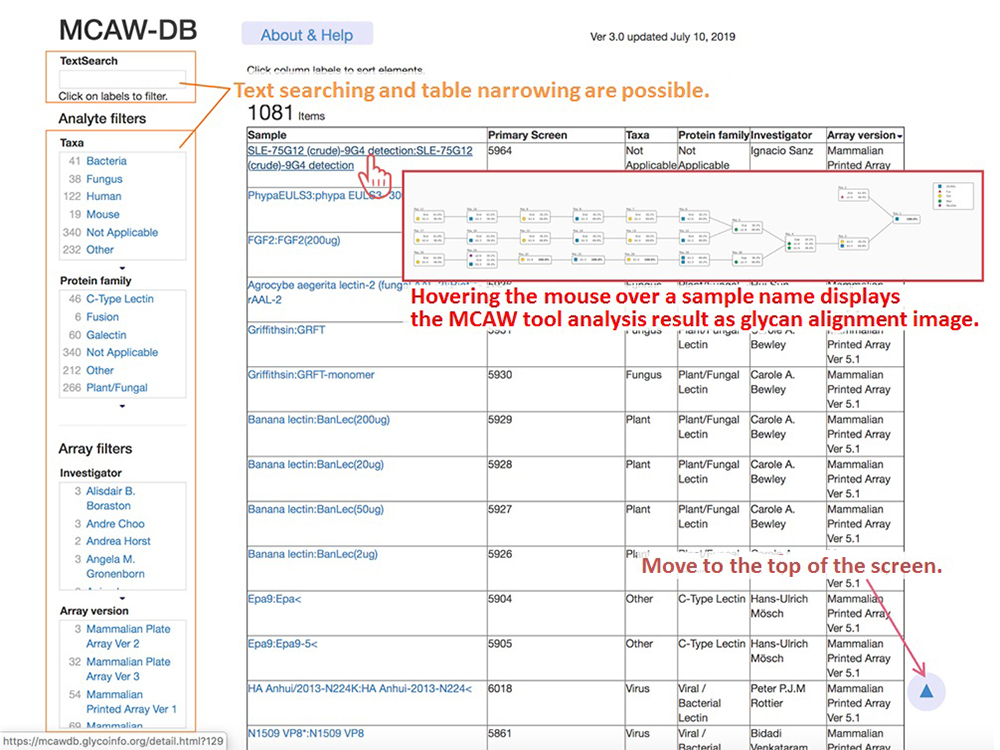
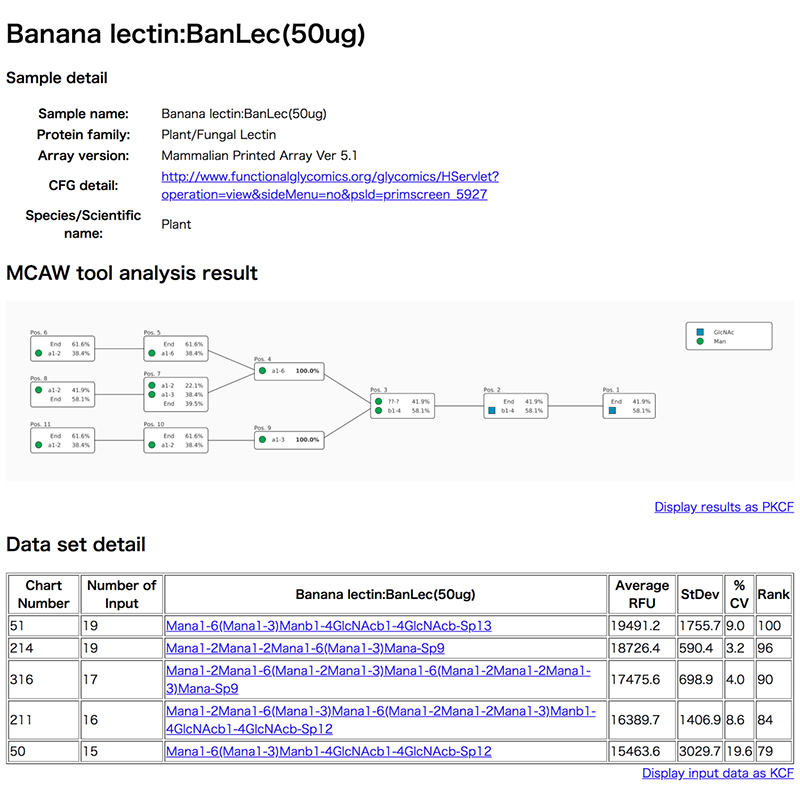
Clicking on a sample name in the list opens a details screen (Fig. 6) in a new window, and displays the glycan alignment image in the center MCAW tool analysis result. At the top of the details screen, there are the sample name, protein family, CFG array version of the glycan array experiment, and detailed links to CFG experiment data. Also, “Data set detail” displays information such as the glycan structure and RFU value of the glycan array of CFG used for the analysis of MCAW tool. The user can view the structure registered in GlyTouCan by following a link for the glycan structure. The “MCAW tool analysis results” are the results of the alignment of the glycan structures in Data set detail. Common sites are expressed as percentages. A display of 100% indicates that the site exists in common among all the analyzed glycan structures. In the case of Figure 6, it can be seen that the two-branched high-mannose N-type glycans have a common glycan structure. “End” is displayed when there is no monosaccharide to align in the glycan structure alignment.
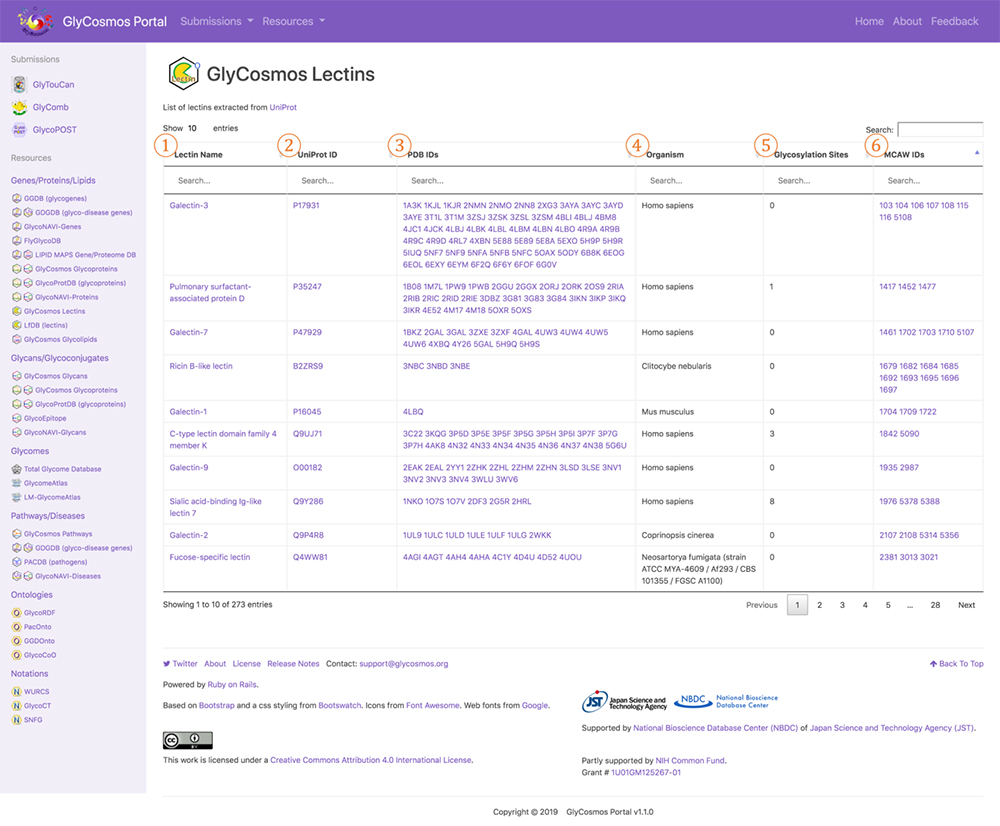
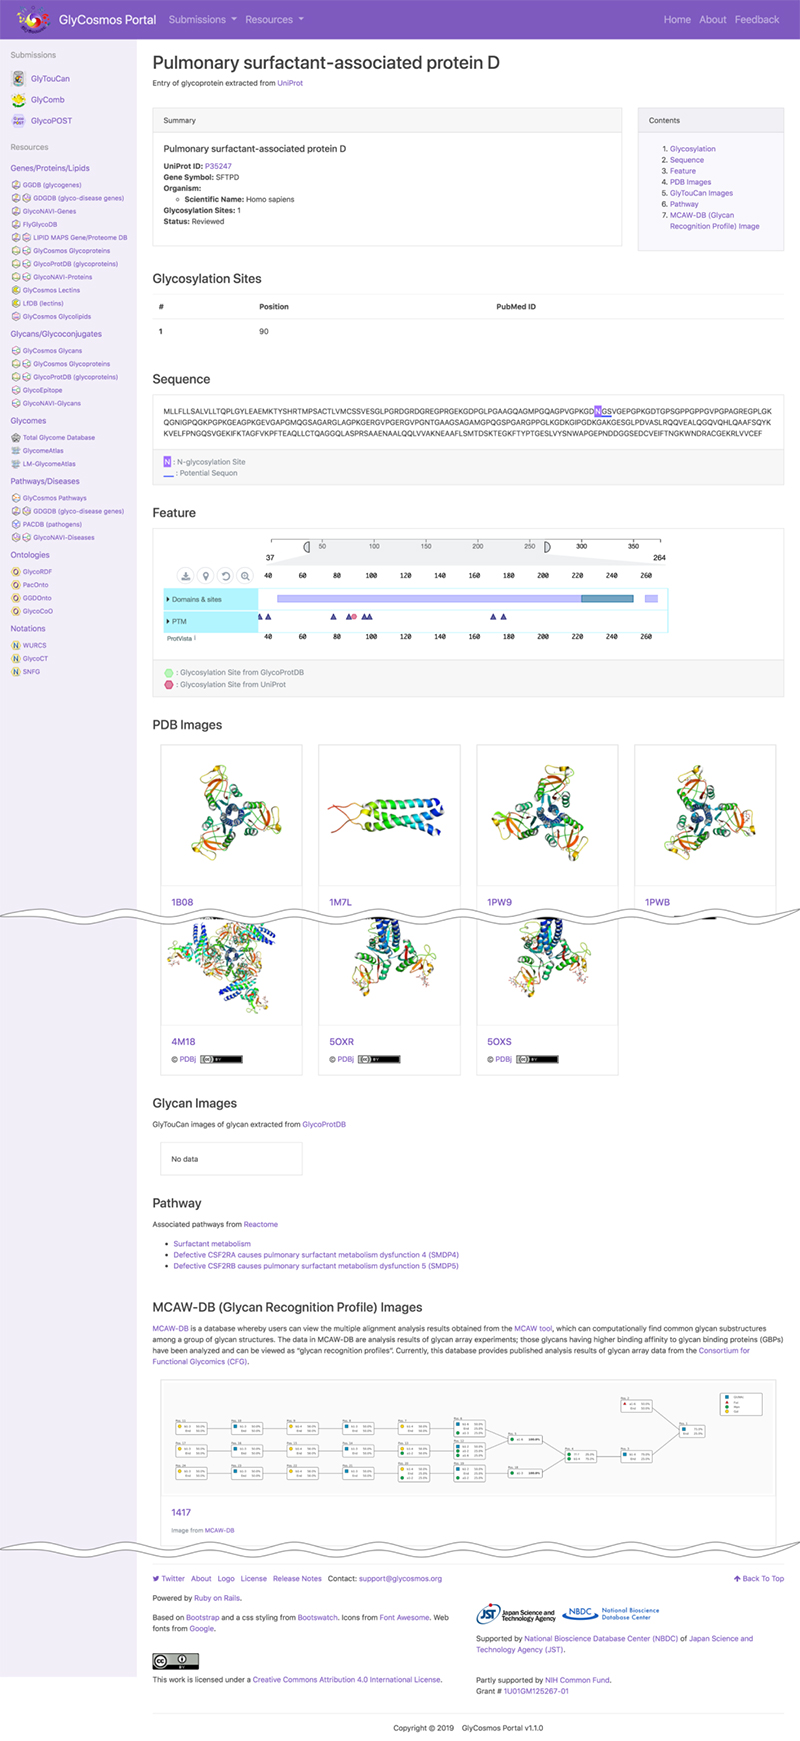
The data resource GlyCosmos Lectins, which has been released on the GlyCosmos portal introduced in this, Glycan and Database series, provides a list of PDBs defined as lectins in UniProt. As shown in Figure 7, horizontal columns titled Lectin Name, UniProt ID, and PDB IDs are followed by those of Organism, Glycosylation Sites (registered in UniProt), and MCAW IDs (listed in MCAW-DB). Here, lectin data integration using Semantic Web technology is possible. A lectin entry is displayed at the lectin name link (Fig. 8). The user can view lectin information based on UniProt. For glycoproteins, glycosylation sites, modified glycan structures, and PDB graphics are displayed, and the lectin pathway information can also be viewed. For lectins registered in the MCAW-DB as GBP, an alignment image will also be displayed.
Even now, new lectins are being discovered and modified lectins are being created, and increasingly effective use of lectins in glycan research is expected. It is necessary to demonstrate new lectin activities in the MCAW-DB and LfDB introduced in this article. In addition, LM-GlycomeAtlas containing data from unanalyzed organs together with analysis of glycoproteins would make comparative analysis possible and useful for the progress of glycoscience research.