PDF version |  This work is licensed under a Creative Commons Attribution 4.0 International License. |

Nozomu Nishi
I graduated from the Department of Chemistry, Faculty of Science, Osaka University in 1975 and then obtained a doctorate degree (Ph.D.) from the Graduate School of Science, Osaka University in 1980. I started my postdoctoral career in the Department of Biochemistry, University of Southern California as a research scholar. After that, I became an assistant professor in the Faculty of Medicine, Kagawa Medical University and then associate professor in the Life Science Research Center, Kagawa University. Currently, I am a visiting researcher at Kagawa University.
I was involved in research on photosynthetic bacteria, prostate/growth factors, and galectins as a protein biochemist.
This note describes unpublished data regarding the expression (in E. coli) and purification of human galectins. I hope that the data and know-how provided below will be useful for researchers (especially for those having limited experience in biochemistry) who are not acquainted with the galectin family and have a need to prepare recombinant galectins.
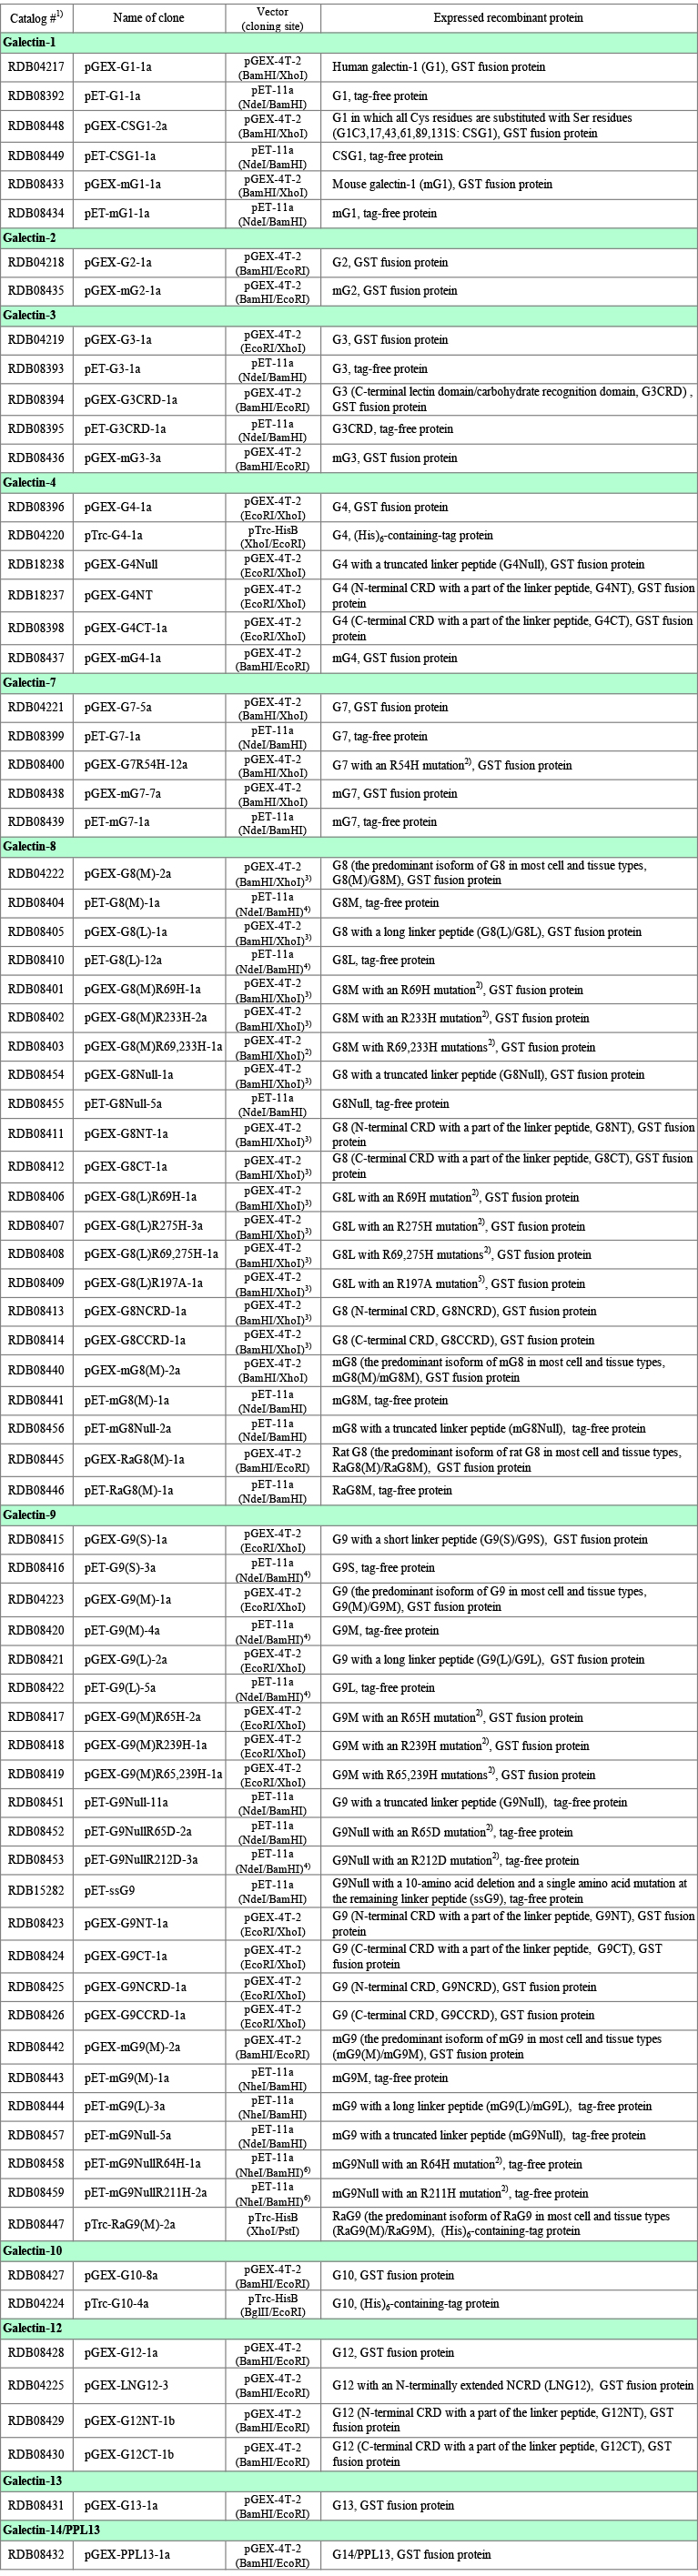
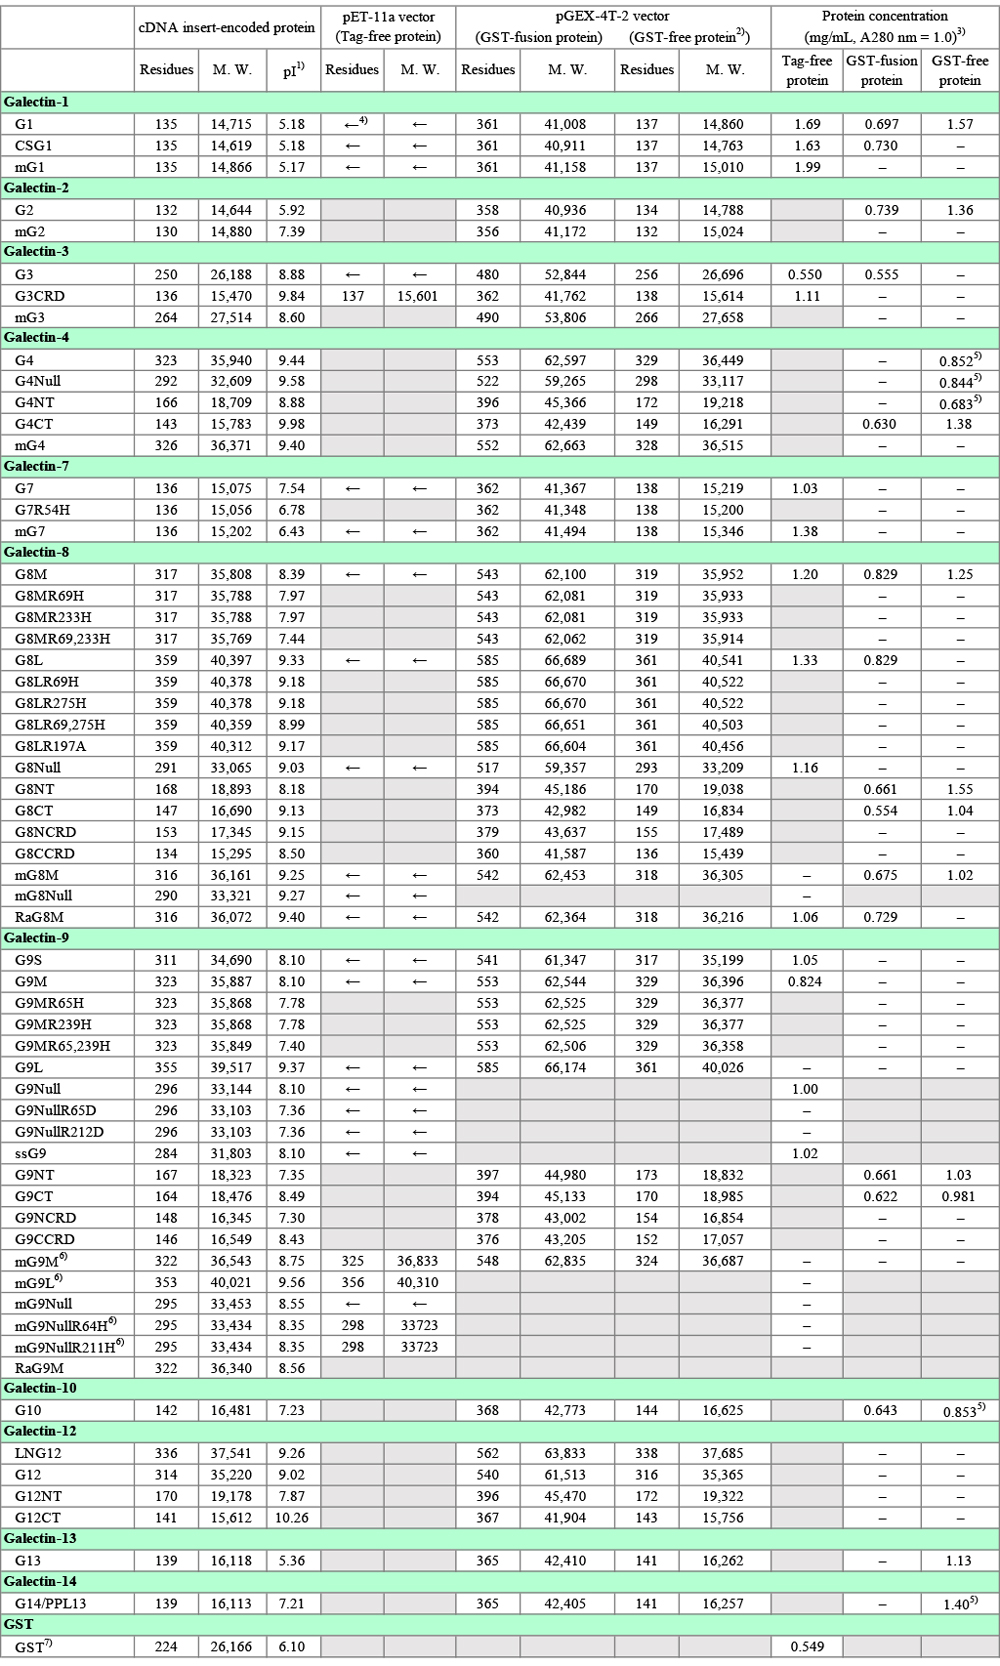
Table 1 summarizes galectin clones (about 60 human clones and about 20 mouse/rat clones) deposited in the Riken BioResource Research Center by the author. The clone information can be obtained at the homepage of the center: Riken BioResource Research Center → Gene Engineering Division > Resources for > Search and Browse > Depositors List → Nishi, Nozomu → individual clone. Detailed description of the clones is given in "Points to be noted for each galectin", if needed. Table 1 contains expression vectors based on pTrcHisB (an E. coli expression vector with a tag sequence with a molecular weight of 4,000 - 5,000). There is almost no benefit to use the pTrcHisB-based vectors for the expression of galectins. Please refer to the right most column of Table 1 for the abbreviations of galectins (ex. galectin-1, G1). The fundamental molecular properties of galectins are summarized in Table 2. The methionine residue corresponding to the initiation codon was assigned to residue 1 in this note, if not otherwise specified.
Proto-type galectins consist of a single CRD (carbohydrate recognition domain). On the other hand, a chimera-type galectin (G3) consists of an N-terminal non-CRD domain (collagen-like domain) and a CRD, and tandem-repeat-type galectins (G4, G8, G9, and G12) consist of an N-terminal CRD, a linker peptide, and a C-terminal CRD. Because it is difficult to strictly determine the boundary between the non-CRD domain/linker peptide and the CRD(s), the region attributed to the CRD described below includes some ambiguity. In addition, the term "CRD" does not mean the minimum unit required for sugar-binding activity but, e.g., the whole molecule of proto-type galectins.
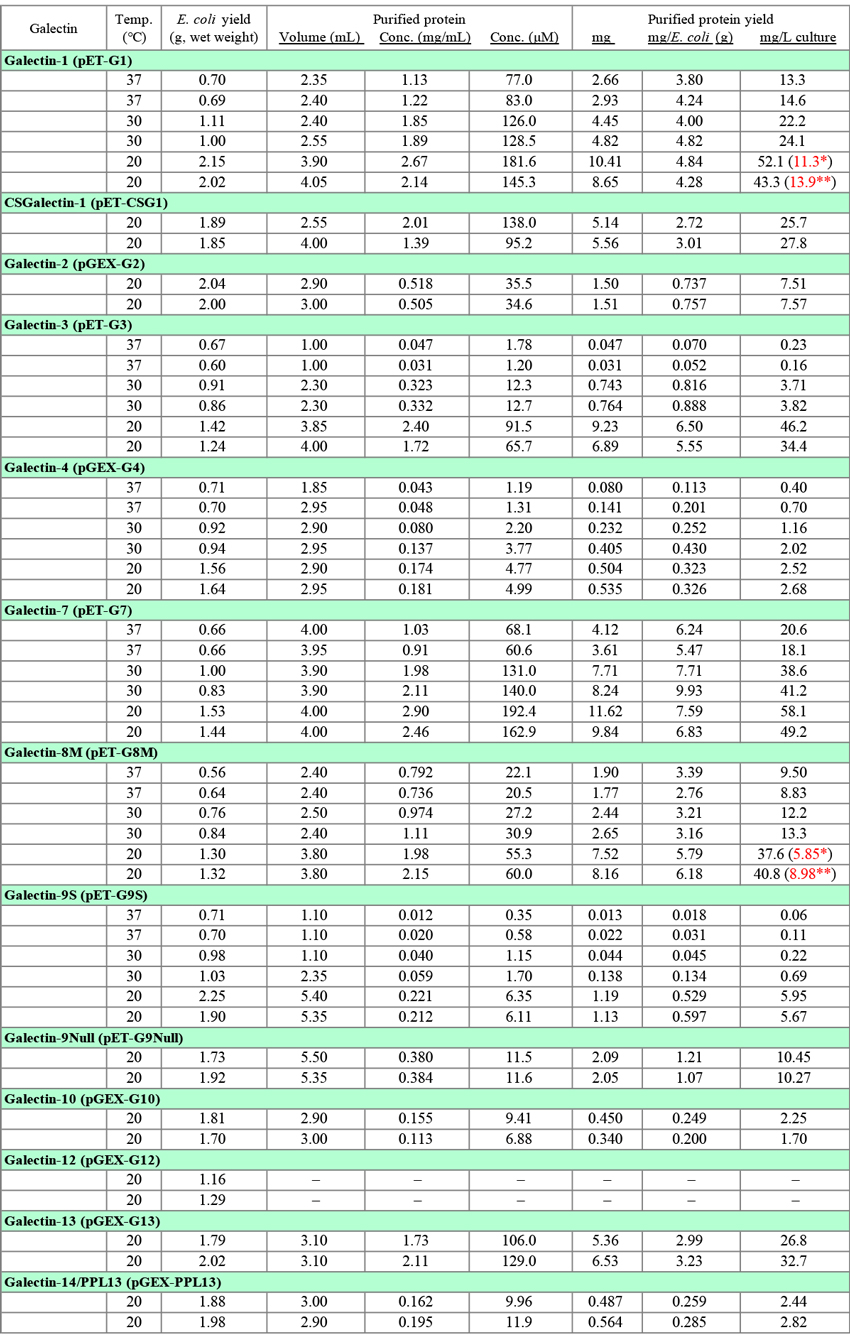
The Data in Table 3, the yields of recombinant galectins, were newly obtained for this note by using the basic methods shown in Fig. 1 (pET vector) and Fig. 2 (pGEX vector). Three different conditions (37°C, 2 h; 30°C, 3 h; 20°C, 16 h) were used for the expression of G1, G3, G4, G7, G8M, and G9S. The expression of other galectins (CSG1, G2, G9Null, G10, G12, G13, and G14/PPL13) was performed under a single condition (20°C, 16 h). Each experiment was carried out twice as shown in Table 3. The GST-free form is designated as the purified protein in the case of GST-fusion proteins (Fig. 2). The protocol shown in Fig. 1 is essentially the same as that posted on the GlycoPOD (GlycoScience Protocol Online Database; Sugar binding proteins: Expression and purification of recombinant human galectin-9), with some modifications. Although this note deals with only E. coli expression system, several types of host cells including bacterial cells (E. coli), yeast cells (S. cerevisiae and P. pastoris), baculovirus-infected insect cells (expres SF+), mammalian cells (COS-1/7, HEK293, and CHO), and moss cells (Physcomitrella patens) were evaluated as to the expression of G9, one of the most difficult-to-express galectins. Among them, E. coli was found to be the best expression host. In addition, codon optimization did not improve the expression of G9 in E coli.
Currently, I am carrying out the expression of galectins at 20°C overnight (14 - 18 h). The yields (mg, mg/L culture) of all the galectins, the expression of which was performed under the three conditions described above, were the highest under 20°C/16 h conditions, as shown in Table 3. However, there is only a little difference in the yields when it is expressed per wet E. coli weight (mg/E. coli [g]) among the three conditions in the cases of G1 and G7. On the other hand, the expression of G3 and G9S is highly sensitive to the expression temperature. It is indispensable to use the low temperature conditions (20°C/16 h) to obtain sufficient amounts of G3 and G9S (also G9Null and ssG9, data not shown). The data shown in Table 3 were obtained through small scale experiments. In general, the yield (mg/L culture) increases on scaling up of the culture volume.
SDS-PAGE analysis of samples at different stages of expression and purification (see "Points to be noted for each galectin") revealed that the centrifugal supernatant of E. coli extract treated batchwise with lactose-agarose (non-adsorbed fraction) and the wash fraction of the lactose-agarose column contained significant amounts of recombinant proteins in some cases. An attempt to recover the recombinant proteins from these fractions resulted in the isolation of considerable amounts of the proteins. The results of recovery experiments for G1 and G8M are shown in Table 3 as red letters*. Since it is cumbersome and time-consuming, there is little merit to carry out the recovery operation when the yield is satisfactory. It may be possible to reduce the recombinant proteins lost in the wash fraction by decreasing the wash buffer volume without lowering the purity of the product. In the case of glutathione-Sepharose, leakage of recombinant proteins (GST-fusion proteins) into the wash fraction was not evident.
* The non-adsorbed fraction is treated batchwise with lactose-agarose in the same manner as the E. coli extract. The recombinant proteins in the wash fraction are isolated by using a column packed with 1 mL of lactose-agarose gel. Other conditions are the same as in Fig. 1 (Step 18/19 - Step 24) .
Procedure
1) Inoculate 10 mL of LB-broth containing 100 µg/mL ampicillin with a loop full of frozen glycerol stock BL21(DE3)* cells carrying the expression plasmid.
* In the case of pET vectors, an expression host containing a chromosomal copy of the T7 RNA polymerase gene under lacUV5 control, e.g., E. coli BL21(DE3), must be used.
↓
2) Incubate the inoculum at 37°C overnight with shaking (200 rpm) in a shaking incubator.
↓
3) Dilute 4.4 mL of the overnight culture with 220 mL of 2xYT medium containing 100 µg/mL
ampicillin in a 1,000-mL flask.
↓
4) Incubate the inoculum at 37°C for ~ 2 h with shaking until the absorbance at 600 nm (A600 nm)
reaches 0.6 - 0.7*.
* Measurements of absorbance were done on samples collected at intervals by withdrawing
culture liquid from the flask.
↓
5) Add 0.22 mL of 0.1 M IPTG (isopropyl-β-thiogalactopyranoside) solution to the culture
(final concentration, 0.1 mM).
↓
6) Incubate the culture at 37°C for 2 h/at 30°C for 3 h/at 20°C for 16 h (overnight) with shaking
(200 rpm).
↓
7) Transfer 200 mL of the overnight culture to centrifuge tubes and then spin down the cells at
6,000 xg for 10 min.
↓
8) Resuspend the pellet in 36 mL of 10 mM Tris-HCl (pH 7.5), 0.5 M NaCl, 1 mM PMSF
(phenylmethylsulfonyl fluoride)*
* 10 mM Tris-HCl (pH 7.5), 0.5 M NaCl, 1 mM PMSF, 1 mM DTT (dithiothreitol) was used
for G1 and mG1.
↓
9) Transfer the cell suspension to a cooling cell and then lyse the E. coli cells using a sonicator*.
* When using a rosette cooling cell and a Sonifier 250 (Branson) equipped with a 1/2" diameter horn, sonicate the cell suspension for 2min x 2 and an additional 1 min (with 1-min intervals between the bursts) with the following settings: % duty cycle, 100; output control, 5.0. Place the cooling cell in an ice-water bath during the sonication.
↓
10) Add 4 mL of 10% (w/v) Triton X-100 to the cell lysate (final concentration, 1%).
↓
11) Mix the lysate for 30 min at 4°C with a magnetic stirrer.
↓
12) Transfer the lysate to a centrifuge tube and then spin down the cell debris at 18,000 xg for
30 min at 4°C.
↓
13) Transfer the supernatant to a 100-mL bottle.
↓
14) Add 2 mL of the lactose-agarose slurry (50%[v/v] in TBS [Tris-buffered saline: 20 mM Tris-HCl, pH 7.5, 0.15 M NaCl]) to the supernatant.
↓
15) Mix the lactose-agarose gel suspension by rotating the bottle for 1 h on a tube rotator*.
* Do not use a magnetic stirrer to avoid destruction of the gel beads.
↓
16) Transfer the gel suspension to a 50-mL conical tube and then spin down the gel at 1,500 xg for 5 min.
↓
17) Discard the supernatant and then suspend the gel pellet in an appropriate volume of TBS, 0.03% CHAPS (3-[(3-cholamidopropyl)dimethylammonio]-1-propanesulfonate).
↓
18) Pack the gel into a column.
↓
19) Wash the gel with 20 gel-bed volumes of TBS, 0.03% CHAPS.
↓
20) Elute the recombinant protein from the gel with 4 mL (1 mL x 4) of TBS, 0.2 M lactose.
↓
21) Dialyze the eluate against PBS*.
* 1st, 4 - 5 h (500 mL); 2nd, overnight (1,000 mL); 3rd, 4 - 5 h (500 mL)
↓
22) Transfer the dialyzed solution to a centrifuge tube, and then spin down the insoluble material at
25,000 xg for 20 min.
↓
23) Sterilize the supernatant with a sterile filter (0.2 µm).
↓
24) Store the sterilized solution at 4 °C.
Procedure
1) Inoculate 10 mL of LB-broth containing 100 µg/mL ampicillin with a loop full of frozen
glycerol stock BL21 cells carrying the expression plasmid.
↓
2) Incubate the inoculum at 37°C overnight with shaking (200 rpm) in a shaking incubator.
↓
3) Dilute 4.4 mL of the overnight culture with 220 mL of 2xYT medium containing 100 µg/mL ampicillin in a 1,000-mL flask.
↓
4) Incubate the inoculum at 37°C for ~ 2 h with shaking until the absorbance at 600 nm (A600 nm) reaches 0.6 - 0.7*.
* Measurements of absorbance were done on samples collected at intervals by withdrawing culture liquid from the flask.
↓
5) Add 0.22 mL of 0.1 M IPTG solution to the culture (final concentration, 0.1 mM).
↓
6) Incubate the culture at 37°C for 2 h/at 30°C for 3 h/at 20°C for 16 h (overnight) with shaking (200 rpm).
↓
7) Transfer 200 mL of the overnight culture to centrifuge tubes and then spin down the cells at 6,000 xg for 10 min.
↓
8) Resuspend the pellet in 36 mL of 10 mM Tris-HCl (pH 7.5), 0.5 M NaCl, 1 mM PMSF*
* 10 mM Tris-HCl (pH 7.5), 0.5 M NaCl, 1 mM PMSF, 1 mM DTT was used for G1 (GST-G1) and mG1 (GST-mG1).
↓
9) Transfer the cell suspension to a cooling cell and then lyse the E. coli cells using a sonicator*.
* When using a rosette cooling cell and a Sonifier 250 (Branson) equipped with a 1/2" diameter
horn, sonicate the cell suspension for 2 min x 2 and an additional 1 min (with 1-min intervals between the bursts) with the following settings: % duty cycle, 100; output control, 5.0. Place the cooling cell in an ice-water bath during the sonication.
↓
10) Add 4 mL of 10% (w/v) Triton X-100 to the cell lysate (final concentration, 1%).
↓
11) Mix the lysate for 30 min at 4°C with a magnetic stirrer.
↓
12) Transfer the lysate to a centrifuge tube and then spin down the cell debris at 18,000 xg for
30 min at 4°C.
↓
13) Transfer the supernatant to a 100-mL bottle.
↓
14) Add 2 mL of the glutathione-Sepharose slurry (50%[v/v] in TBS) to the supernatant.
↓
15) Mix the glutathione-Sepharose gel suspension by rotating the bottle for 1 h on a tube rotator*.
* Do not use a magnetic stirrer to avoid destruction of the gel beads.
↓
16) Transfer the gel suspension to a 50-mL conical tube and then spin down the gel at 1,500 xg for
5 min.
↓
17) Discard the supernatant and then suspend the gel pellet in an appropriate volume of TBS,
0.03% CHAPS.
↓
18) Pack the gel into a column.
↓
19) Wash the gel with 20 gel-bed volumes of TBS, 0.03% CHAPS.
↓
20) Wash the gel with 2 gel-bed volumes of PBS.
↓
21) Add 1 mL of thrombin solution (50 u/mL in PBS) to the gel in the column, and then mix.
↓
22) Incubate the gel suspension (in the column) at 25°C for 16 h (overnight) with shaking (120 rpm).
↓
23) Drain the GST-free recombinant protein solution from the column (eluate-1).
↓
24) Elute the GST-free recombinant protein from the gel with 2 mL (1 mL x 2) of PBS (eluate-2).
↓
25) Dialyze the combined eluates (eluate-1 and eluate-2) against PBS*.
* 1st, 4 - 5 h (500 mL); 2nd, overnight (1,000 mL); 3rd, 4 - 5 h (500 mL)
↓
26) Transfer the dialyzed solution to a centrifuge tube, and then spin down the insoluble material at
25,000 xg for 20 min.
↓
27) Sterilize the supernatant with a sterile filter (0.2 µm).
↓
28) Store the sterilized solution at 4 °C.
・Step 1
According to the manual for a GST Gene Fusion System (GST Gene Fusion System Handbook 18-1157-58 AD 11/2014, GE Healthcare Life Sciences; hereinafter referred to as "GST manual"), it is recommended that 2xYT (+ ampicillin) be used as the culture medium from this step.
・Step 3
The main culture is performed using a 1,000-mL flask containing 220 mL of the expression medium (+ overnight culture). In general, an increase in the culture volume (ex. 400 mL of the medium in a 1,000-mL flask) does not affect the yield (mg/L culture) of recombinant proteins. Note that, because two-ply aluminum foil is used to cover the flasks in the experiment, it is possible that the yield changes when a culture stopper with lower air permeability is used.
GST manual: Dilute the overnight culture 1:100 with the expression medium.
・Step 4
Two mL of the culture medium is periodically collected from the flask placed in an incubator shaker to check the absorbance*. The process, thus, is not completely sterile. In the case that the culture is carried out at 30°C or 20°C after the addition of IPTG (isopropyl β-D-1-thiogalactopyranoside), the temperature setting of the incubator shaker is changed when A600 nm reaches around 0.5. IPTG is added at the point when A600 nm reaches 0.60 - 0.65 in most experiments. The value (A600 nm) is somewhat ambiguous, because it fluctuates significantly when a conventional spectrophotometer is used.
* Actually it is not the absorption but mainly due to scattering of the measuring light.
GST manual: Add IPTG when A600 nm reaches 0.5 - 2 at a final concentration of 0.1 - 1 mM.
・Step 8
E. coli resuspension buffer, 10 mM Tris-HCl (pH 7.5), 0.5 M NaCl, 1 mM PMSF (phenylmethanesulfonyl fluoride, synonym: benzylsulfonyl fluoride)*, used in the experiments is not optimized for the purification of recombinant galectins. The volumes of resuspension buffer and culture medium are kept in a constant ratio of 0.18 (0.2 including Triton X-100) when the culture volume is changed. PMSF is unstable in water. Since decomposition of PMSF proceeds even if DMSO (dimethyl sulfoxide) is used as a solvent (due to contaminating water), it is essential to prepare the PMSF solution at the time of use.
* The buffer is supplemented with 1 mM DTT (dithiothreitol) when used for G1/mG1 (refer to the section for G1). Although DTT may affect the purity and yield of recombinant proteins in addition to the lectin activity of G1/mG1, we have not examined this point.
GST manual: Use 5 mL of PBS per 100 mL of culture to resuspend the E. coli pellet.
・Step 9
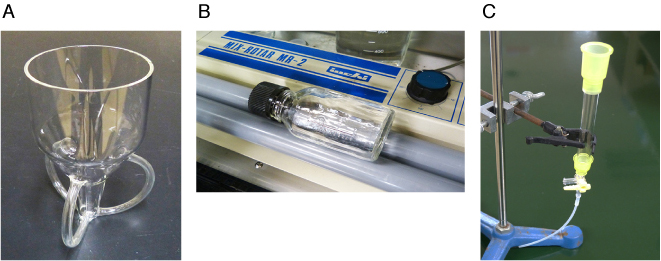
A rosette cooling cell (Fig. 3A) placed in an ice-water bath is used to facilitate efficient cooling of the E. coli suspension during sonication. Although it is not clear to what extent the increase in the sample temperature induced by sonication affects the yield and/or activity of recombinant galectins, it may be necessary to decrease one sonication time and increase the number of processings when a sonication container with poor cooling efficiency is used.
・Step 10
Triton X-100 (final concentration, 1%[v/v]) is added to facilitate solubilization of recombinant galectins (same condition as in the GST manual). Because the condition is customarily used like the E. coli resuspension buffer, a thorough examination has not been made as to purification of recombinant galectins.
・Step 14
Generally 1.5 mL of affinity gel is used for 400 - 500 mL of culture. Instead, 1 mL of the gel per 200 mL of culture was used in the experiments, since too small an amount of the gel may result in a significant error in the yield due to the loss of the gel in the steps hereafter. The binding capacity of lactose-agarose is 5.0 mg/mL gel (= 51 nmol/mL gel) of peanut agglutinin (molecular weight = 98,000) according to the product specification (Honen Corporation). The results in Table 3 show that about 600 nmol (300 nmol, if a dimer is considered as a single molecule) and about 200 nmol of G1 and G8M, respectively, are purified using 1 mL of lactose-agarose gel. Taking into account that significant amounts of G1 and G8M are found in the non-adsorbed and wash fractions, as described above, the possibility cannot be ruled out that the amount of the gel is insufficient for highly expressed galectins like G1, G3, G7, and G8M. The GST manual recommends that 0.2 mL of glutathione-Sepharose be used for 400 mL of culture (column method; assumed yield, 1 mg of GST-tagged protein per 400 mL of culture). I feel that the amount of glutathione-Sepharose gel recommended in the GST manual is too small. The binding capacity of glutathione-Sepharose is > 5.0 mg GST/mL gel and 25 mg horse liver GST/mL gel according to the product specification (GE Healthcare) and GST manual, respectively.
The batch adsorption method is used in this note, because there were some cases in which the column method was practically unavailable due to the high viscosity of E. coli extracts in the purification of recombinant proteins. Note that I have not experienced such a viscous E. coli extract in the case of galectins.
・Step 15
Refer to Fig. 3B.
・Step 18
An Econo-Column chromatography column (1.0 x 10 cm, Bio-Rad) is used. An extension tube of about 10 cm long is attached to the column outlet during gel packing and washing to increase the flow rate (Fig. 3C). The extension tube is removed during elution.
・Step 19
The washing buffer contains 0.03% CHAPS (3-[(3-cholamidopropyl)dimethylammonio]-1-propanesulfonate), an amphoteric (twitter ionic) surfactant. I prefer to use CHAPS because of its various advantages for handling proteins 1, even though it is relatively expensive. Washing buffers without a detergent or with a non-ionic detergent*, like Tween 20, may be used without lowering the purity of the product recombinant galectins.
* In general, non-ionic detergents have some disadvantages when compared with ionic detergents: They are difficult to remove by dialysis due to lower critical micellar concentrations and a higher mass of micelles, show higher cytotoxicity, and frequently exhibit high absorbance at 280 nm. Non-ionic detergents must be washed out before elution if they are included in the washing buffer.
・Step 20(Fig. 1)
The elution buffer, TBS, 0.2 M lactose, is routinely used for lactose-agarose affinity chromatography. G9 shows relatively high affinity for lactose among the members of the galectin family. Purified G9 adsorbed to a lactose-agarose column is eluted with lactose at concentrations of 10 - 15 mM when gradient elution is performed. Therefore it may be possible to lower the lactose concentration in the elution buffer to 50 - 100 mM. It is also possible to use galactose (500 mM) instead of lactose as an eluent, though it is more expensive than lactose. G9 is eluted with galactose at concentrations of 200 - 250 mM under the above mentioned conditions. On X-ray crystallographic analysis, lactose molecules bound to a part of galectin molecules are detectable in some cases even if extensive dialysis is performed to remove lactose in the sample 2. Although I have not examined it, it may be possible to obtain sugar-free galectin crystals by using galactose as an eluent when lactose affinity chromatography is used for purification.
The affinity gels (lactose-agarose and glutathione-Sepharose) can be used repeatedly after regeneration. The used gels are stored at 4°C in the presence of a preservative like sodium azide, and regenerated as follows: The used gel (~ 20 mL) packed in an Econo-Column chromatography column (2.5 x 10 cm) is washed in sequence with 2 bed volumes of PBS, 2 bed volumes of 6 M guanidine hydrochloride, and 5 bed volumes of PBS, and then suspended in PBS, 0.05% NaN3 to make a 50% (v/v) slurry. The regeneration time is not limited. In the case that thrombin is added to the GST-fusion proteins adsorbed to glutathione-Sepharose gel (Fig. 2, Step 21 and thereafter), the gel is washed with 50 mM Tris-HCl (pH 8.0), 10 mM glutathione (1 mL x 4, 5-min interval between washings) after recovery of GST-free galectins to remove the GST moiety adsorbed to the gel.
・Step 21(Fig. 1)
The dialysis conditions (volume of external solution, etc.) are routinely used. A reduced volume of the external solution and shorter exchange cycles with an increased exchange number may result in more efficient removal of lactose, etc., I do not have supporting data though.
・Step 24(Fig. 1)
The stability of each galectin is described in "Points to be noted for each galectin", if needed. The tandem-repeat type galectins (except for Null-type mutants) are generally unstable compared to the proto-type and chimera-type galectins. The linker region of the tandem-repeat type galectins is highly susceptibility to contaminating proteases in the purified preparations. Care must be taken to store purified galectins in a freezer, to avoid possible irreversible insolubilization.
・Step 20(Fig. 2)
GST-fusion proteins adsorbed to glutathione-Sepharose gel are treated with thrombin in the experiments (Fig. 2, Step 21 and thereafter). In the cases that galectins are used as GST-fusion proteins or thrombin treatment is carried out in solution, GST-fusion proteins are eluted with 50 mM Tris-HCl (pH 8.0), 10 mM glutathione at this step. Refer to the GST manual for the precautions when eluting GST-fusion proteins.
・Step 21, 22(Fig. 2)
The thrombin solution is mixed with the glutathione-Sepharose gel in a column with a vortex mixer. Although efficient mixing is not possible, the column covered with parafilm is shaken in an incubator shaker during overnight incubation. In this note, overnight processing was performed uniformly, but the reaction may be completed within several hours. When degradation of recombinant galectins by contaminating E. coli-derived proteases is evident, it is necessary to examine the treatment conditions such as shortening the time (increasing thrombin if necessary).
・Step 23 ~ 27(Fig. 2)
The solutions (eluate-1 and eluate-2), which contain GST-free galectins, show relatively high absorbance at 280 nm. However, the absorbance greatly decreases on dialysis and centrifugation. The case of G4 (20°C, 16 h) is shown below as an example. Eluate-1 and eluate-2 (1st and 2nd) are mixed, dialyzed, and then centrifuged. The resulting supernatant is sterilized by filtration. The sample name "supernatant" means the sterilized supernatant.
| Sample | Volume (mL) | A280 nm |
| eluate-1 | 1.0 | 1.346 |
| eluate-2 (1st) | 1.0 | 1.241 |
| eluate-2 (2nd) | 1.0 | 0.348 |
| supernatant | 2.9 | 0.204 |
The protein (GST-free G4) concentration estimated by SDS-PAGE of each sample reveals that the decrease in A280 nm cannot be explained by loss of the protein during the treatments (data not shown). It is most probable that eluate-1 and eluate-2 contain nucleic acids, which are removable by dialysis, because the UV absorbance peaks of eluate-1/-2 and supernatant are at 260 nm and 280 nm, respectively. The situation is the same for other GST-fusion proteins.
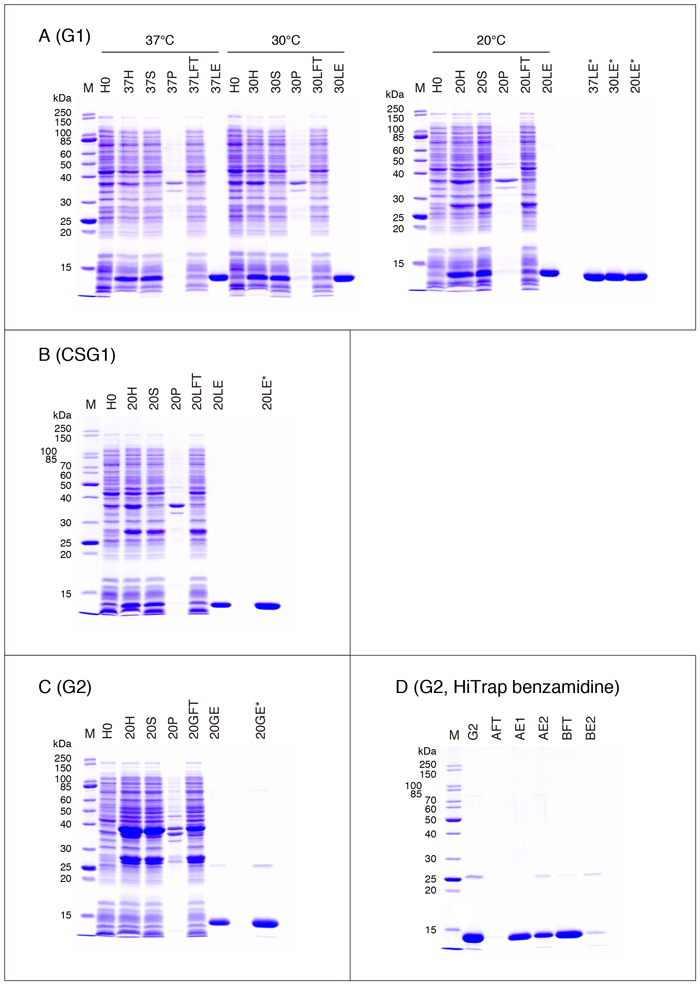
Each purified galectin preparation contains thrombin. It is possible to remove thrombin by using a benzamidine-Sepharose or HiTrap benzamidine FF(HS) column (GE Healthcare Life Sciences), if needed (refer to the GST manual). Note that care must be taken when using benzamidine-immobilized carriers. Since benzamidine has a plus charge at around the neutral pH (acid dissociation constant: 11.90 ± 0.40), acidic proteins like G2 (GST-free G2, pI = 5.92) in addition to thrombin are adsorbed if eluate-1/-2 (PBS solution) is directly applied to the benzamidine immobilized carriers (Fig. 4D, AFT; see below for explanation of the figure). The problem can be avoided by increasing the NaCl concentration of the sample to 0.5 M (Fig. 4D, BFT). For example, add 0.08 mL of 5 M NaCl to 1 mL of PBS solution.
The experiment shown in Fig. 4D is done at 2X scale compared to that shown in Fig. 2. A mixture of eluate-1 and eluate-2 (6 mL) is divided into two equal volumes. One part (A) is directly applied to a HiTrap benzamidine FF(HS) column (1 mL) equilibrated with PBS. The other part (B) is supplemented with 5 M NaCl to make the final concentration 0.5 M, and then applied to another column equilibrated with 20 mM Na-Pi (sodium phosphate) (pH 7.5), 0.5 M NaCl. The non-adsorbed fraction (flow-through fraction) is saved. The adsorbed substances are eluted with 20 mM Na-Pi (pH 7.5), 0.5 M NaCl and then with 0.1 M Glycine-HCl (pH 2.7) (each 2 mL) in the case of A. While they are eluted with 0.1 M Glycine-HCl (pH 2.7) (2 mL) in the case of B. The amounts of samples analyzed by SDS-PAGE are adjusted to make it possible to directly compare the intensity of the stained bands. Note that two types of molecular weight marker kits (Unstained Protein Standard, Broad Range [10-200 kDa], P7704 and P7717, New England BioLabs) are used in Fig. 4 - 7 & 9. In Fig. 4D, P7717 is used.
| G2: | eluate-1 + eluate-2 |
| AFT, BFT: | non-adsorbed fraction |
| AE1: | elution fraction with 20 mM Na-Pi (pH 7.5), 0.5 M NaCl |
| AE2, BE2: | elution fraction with 0.1 M Glycine-HCl (pH 2.7) |
GST manual:
The expression and purification profiles of galectins on SDS-PAGE are shown in Fig. 4 (A - C), Fig. 5 (A - C), Fig. 6 (A - C), and Fig. 7 (A, C, D, and E). The samples are obtained from the experiments shown in Table 3 (one of the two experiments). Explanation of the samples subjected to SDS-PAGE is as follows.
| H0: | E. coli cells just before the addition of IPTG (Step 4) |
| H (37H/30H/20H; the same hereinafter): | E. coli cell homogenate treated with Triton X-100* (Step 11) |
| S: | supernatant obtained by centrifugation of H (Step 12) |
| P: | precipitate obtained by centrifugation of H (Step 12) |
| LFT: | supernatant obtained by centrifugation of S treated with lactose-agarose in a batchwise manner (Step 16) |
| GFT: | supernatant obtained by centrifugation of S treated with glutathione-Sepharose in a batchwise manner (Step 16) |
| LE: | final preparation (purified G1, etc.) (Step 23, Fig. 1) |
| GE: | final preparation (purified G2, etc.) (Step 27, Fig. 2) |
| Amount of the sample subjected to SDS-PAGE: | H0 - LFT/GFT, 0.1 mg wet pellet equivalent**/10 µL (10 µL/lane) LE/GE, differs with galectin species (described in legends to figures) |
* Although the reason is not clear, the expressed protein band is not detectable in some cases when the E. coli cell homogenate before treatment with Triton X-100 (Step 8, 9) is used for SDS-PAGE.
** In the cases of H - LFT/GFT, the sample corresponding to or derived from 0.1 mg of wet E. coli pellet (0.1 mg wet pellet equivalent) obtained at Step 7 is analyzed. For example, the wet weight of the E. coli pellet is 0.70 g in the case of G1 (the first experiment performed at 37°C, see Table 3). Since the pellet is suspended in 40 mL of the extraction buffer (including Triton X-100, Step 10/11), the concentration is 17.5 µg wet E. coli pellet/µL (17.5 µg wet pellet equivalent/µL) when the pellet volume is ignored. The conditions to prepare 100 µL of sample solution subjected to SDS-PAGE are shown below.
Sample (Step 11), 57.1 µL + SDS sample buffer (4X)*, 25 µL + H2O, 17.9 µL
* 0.25 M Tris-HCl (pH 6.8), 8%(w/v) SDS, 20%(v/v) mercaptoethanol, 25%(w/v) glycerol
To prepare the H0 sample for electrophoresis, the relationship between E. coli wet weight and A600 nm of the E. coli culture is calculated from A600 nm of the overnight culture (Step 6). In the case of G1 described above, the E. coli wet weight obtained from 1 mL of the overnight culture with an absorbance of 1.0 (A600 nm = 1.0) is determined to be 2.38 mg. This relationship is applied to the culture just before the addition of IPTG (H0 sample). The value significantly fluctuates among different E. coli clones. The average and standard deviation are as follows: 1.93 ± 0.55 mg (n = 50). Because the absorbance of the culture obtained just before the addition of IPTG is 0.63, the wet weight of the E. coli pellet obtained by centrifugation of 1 mL of the culture is calculated to be 1.50 mg*. The sample solution for SDS-PAGE (0.1 mg wet pellet equivalent/10 µL) can be obtained by treating the pellet (1.50 mg) with 150 µL of SDS sample buffer (1X) when the pellet volume is ignored. It is difficult to strictly determine A600 nm of the E. coli culture using a conventional spectrophotometer, as described in the comment to Step 4. In addition, the linearity between E. coli cell density and the absorbance is lost as the density increases. The absorbance of the overnight culture (Step 6) is determined after dilution to make the value lower than 0.7.
* The E. coli cell pellet (H0 sample) is stored frozen until the relationship between E. coli wet weight and A600 nm of the overnight culture is determined.
・G1
Previously, galectins were termed S-type lectins, as opposed to C-type lectins, due to their presumed requirement of reduced cysteine residues for the lectin activity. The name, S-type lectin, is still used, though the term is inappropriate. It is well known that G1 loses lectin activity upon oxidation of cysteine residues (both intramolecular and intermolecular disulfide bond formation), which induces three-dimensional structural alteration of the molecule. The lectin activity of G1 does not depend on reduced cysteine residues 3. DTT is added to the E. coli resuspension buffer at a concentration of 1 mM (Step 8, Figs. 1 and 2) but not to the dialysis buffer in the case of G1/mG1. The lectin activity of G1 determined by hemagglutination assay decreases to about 1/4 after 10 days of storage at 4°C under sterile conditions 4. The activity decreases to about 1/4 after 20 days of storage even if the final preparation is supplemented with 1 mM DTT. The hemagglutination assay is a simple and sensitive assay and widely used to assess lectin activity. In general, galectins exert their action on cultured cells at concentrations higher than those required for hemagglutination. It is possible, thus, galectin preparations with detectable hemagglutination activity practically lack biological activity toward cultured cells (refer to the sections for G7 and G8).
CSG1 is a cysteine-less mutant of G1 with all Cys residues substituted with Ser residues 4. CSG1 can be stored without loss of activity in the absence of a reducing agent. Because the mutations do not alter the oligosaccharide specificity or three-dimensional structure, CSG1 can be used as a stable substitute for G1. G1 can obtain neurotrophic activity through oxidation. It has been reported that G1 acquires axonal regeneration promoting activity via macrophages with concomitant loss of lectin activity on the formation of three intramolecular disulfide bonds 5. Therefore, CSG1 is not a perfect substitute for G1, in that there is not the possibility of oxidation-induced acquisition of neurotrophic activity.
・G2
It is practically impossible to purify G2 by lactose-agarose affinity chromatography, though G2 has detectable affinity for lactose 6,7. Note that, because the affinity of G2 for lactose was determined using pyridylamidated or p-nitrophenylated saccharide derivatives in previous studies, the affinity for lactose immobilized to agarose may differ from the reported value. It is most probable that the minor material with a molecular weight of about 26,000 in the purified G2 preparation (Fig. 4C) is contaminating GST moiety removed from GST-G2 on thrombin digestion (see Fig. 7B).
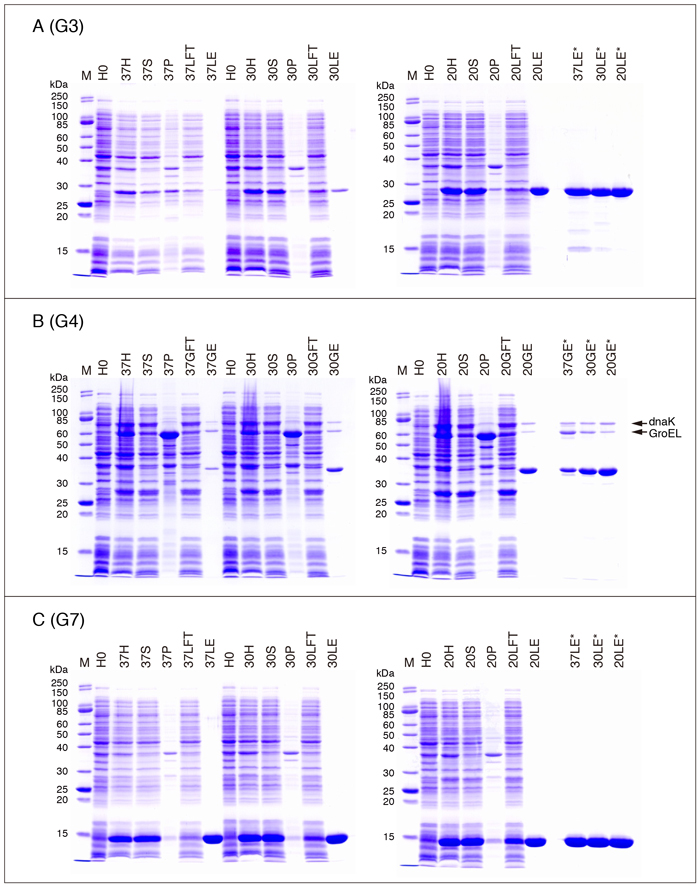
・G3
Purified G3 preparations (3 µg/10 µL [10 µL/lane]) obtained at three different temperatures are electrophoresed in the right lanes of Fig. 5A. The protein concentrations of the preparations are 47 µg/mL (37°C), 323 µg/mL (30°C), and 2.40 mg/mL (20°C). Therefore it is not possible to prepare the sample for electrophoresis (3 µg/10 µL) using SDS sample buffer (4X) except for the purified G3 preparation obtained at 20°C. The samples obtained at 37°C and 30°C are concentrated with SCR (StrataClean Resin) before the SDS treatment to achieve the final concentration of 3 µg/10 µL. Refer to "Supplementary explanation" for the concentration of dilute protein solutions with SCR.
G3 is a sole member of the chimera-type galectin subfamily consisting of an N-terminal non-CRD domain (collagen-like domain) and a C-terminal CRD. G3CRD corresponds to the C-terminal CRD*. The yield of G3CRD (pET-G3CRD, 20°C/overnight ) is about 3 mg/L culture (less than 10% of that of G3) under conditions similar to those in Table 3.
* An extra Met residue corresponding to the cloning site (NdeI site) is attached to the N-terminal of the product of pET-G3CRD.
・G4
It is practically impossible to purify G4 by lactose-agarose affinity chromatography like G2.
The purified G4 preparations obtained at all the temperatures are concentrated with SCR before the SDS treatment (Fig. 5B, 37GE*/30GE*/20GE*). Although the intensity of the stained bands should be the same for the three preparations, they apparently differ from each other. It is likely that the protein concentrations of the samples, especially those obtained at 37°C and 30°C, calculated based on the absorbance at 280 nm are overestimated due to contaminating non-protein substances, possibly nucleic acids. Two minor bands with molecular weights of about 76,000 (upper band) and 63,000 (lower band) in the purified G4 preparation are DnaK and GroEL, respectively (Fig. 5B). The identities of the bands are confirmed by N-terminal amino acid sequence analysis*. It is possible to remove DnaK to some extent by washing the glutathione-Sepharose column (Fig. 2, Step 19) with an ATP solution (refer to the section for G10).
* N-terminal amino acid sequence of the upper band: GKIIGIDLGT
N-terminal amino acid sequence of the lower band: AAKDVKFGNDARVKM
The structures of G4Null, G4NT, and G4CT are as follows:
| G4Null: | N-terminal CRD (Met1 - Gln153) + two parts of the linker peptide (Pro154-Leu155 + Thr187 - Pro191) + C-terminal CRD (Val192 - Ile323) |
| G4NT: | N-terminal CRD (Met1 - Gln153) + a part of the linker peptide (Pro154 - Tyr166) |
| G4CT: | a part of the linker peptide (Thr181 - Pro191) + C-terminal CRD (Val192 - Ile323) |
The yields of G4Null, G4NT, and G4CT (GST-free proteins) are about 1.6 mg/L culture, 10 mg/L culture, and 20 mg/L culture, respectively, under conditions similar to those in Table 3.
・G7
G7R54H is a mutant with a substitution of Arg54 to His. Arg54 is one of the important amino acid residues which constitute the carbohydrate-binding site of G7. The carbohydrate-binding activity of G7 is almost completely abolished by the mutation. However, it is possible that the mutant retains detectable hemagglutination activity. The situation is the same for other galectins with analogous mutations (refer to the section for G8).
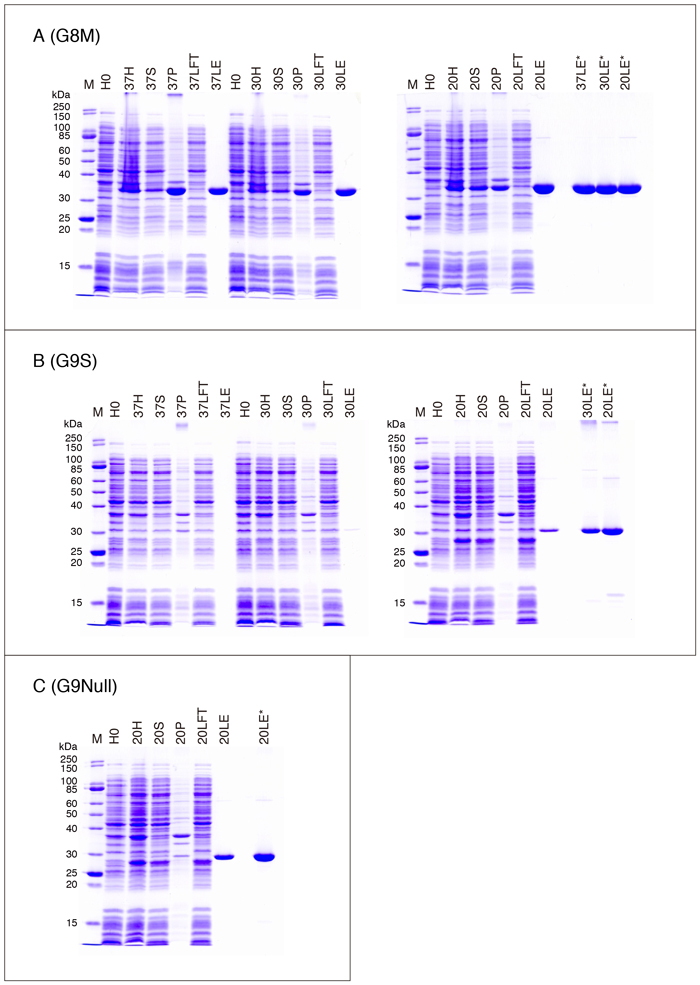
・G8
There are at least two G8 isoforms (splicing isoforms: G8M and G8L), which only differ in the linker peptide region. The lengths of the linker peptides are 28 and 70 amino acid residues for G8M and G8L, respectively. The yield of G8L (pET-G8L) is comparable to that of G8M. G8MR69H (G8LR69H) and G8MR233H (G8LR275H) are mutant forms carrying Arg-to-His mutations at the N- and C-terminal CRDs, respectively, of G8M (G8L). The mutations are analogous to that of G7 described above. G8MR69,233H (G8LR69,275H) has the mutation at both CRDs. The two CRDs of G8 exhibit quite different affinities for lactose: The N-terminal CRD has relatively high affinity, while the C-terminal CRD has practically no affinity for lactose 6,7. Therefore, lactose-affinity chromatography is not applicable to the G8 mutants with an inactivated N-terminal CRD even if the C-terminal CRD is in the native form. I have reported that G8MR69H exhibits a lower (compared to the wild-type G8) but significant affinity for asialofetuin-agarose 8. G8MR69H, however, cannot be retained on an asialofetuin-agarose column unless it is washed minimally.
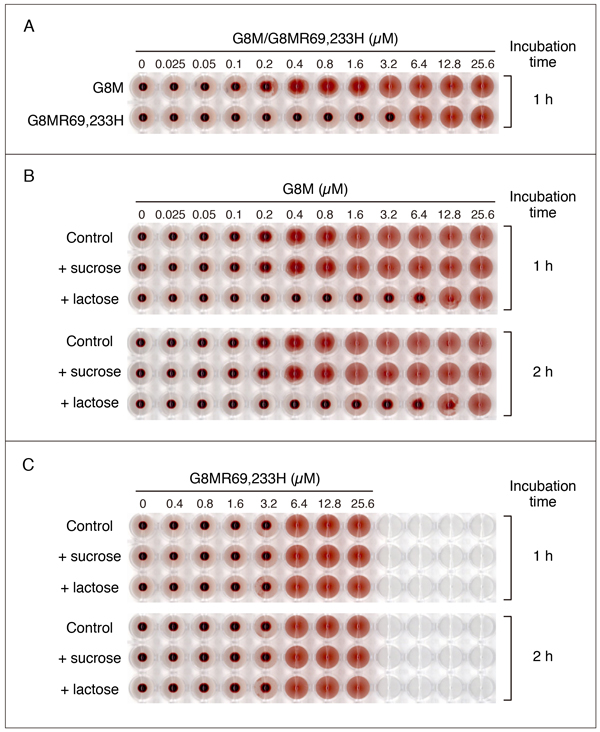
As mentioned in the section for G7, it is possible that a mutant galectin with a substitution(s) of His for Arg at the carbohydrate biding site(s) may exhibit hemagglutination activity. Fig. 8 shows the hemagglutination activity of G8MR69,233H in comparison with that of G8M (refer to "Supplementary explanation" for the hemagglutination assay). G8M exhibits a relatively low activity among the members of the galectin family: The minimum concentration required for hemagglutination under the conditions used is 0.2 - 0.4 µM (Fig. 8A). G8MR69,233H exhibits the activity at 6.4 µM or higher, suggesting that the double mutant retains about 3 - 6% of the wild-type activity. The activity of G8M at 6.4 µM or lower is inhibited by 50 mM lactose. Although hemagglutination by high concentrations (12.8 and 25.6 µM) of G8M is hardly inhibited, a weak inhibitory effect is observed at 12.8 µM when the incubation time is extended to 2 h (Fig. 8B). On the other hand, G8MR69,233H-induced hemagglutination is not inhibited by 50 mM lactose regardless of the incubation time (Fig. 8C). The results apparently show that G8MR69,233H has hemagglutination activity. However, it is not clear whether this is based on the residual lectin activity.
G8LR197A is a mutant with a substitution of Arg197 to Ala at the linker peptide. There is a sequence recognized by thrombin (-IAPRT-) in the linker peptide of G8L but not that of G8M. The mutation eliminates the sensitivity of G8L to thrombin 9. Therefore, thrombin treatment of GST-G8L without this mutation (the products of pGEX-G8(L), pGEX-G8(L)R69H, pGEX-G8(L)R275H, and pGEX-G8(L)R69,275H) results in not only excision of the GST moiety but also dissociation of the two CRDs.
The linker peptide of the tandem-repeat-type galectins is a so-called "disordered region" (refer to "Supplementary explanation"), which does not form a fixed three-dimensional structure and is highly susceptible to a variety of proteases. In addition, it is not possible to completely remove proteases of E. coli origin from recombinant protein preparations by a single affinity chromatography. G8Null is a mutant form of G8 lacking most of the linker peptide and highly resistant to proteolytic degradation/inactivation 10. The yield of G8Null (pET-G8Null) is about 40 mg/L culture. Note that a restriction enzyme site (NdeI site: CATATG), which is used to construct the expression vector, exists at the connecting point of two cDNAs coding for the N- and C-terminal CRDs. Accordingly, an extra two amino acid residues (HM) corresponding to the restriction enzyme site exist in G8Null. The structures of G8Null, G8NT, G8CT, G8NCRD, and G8CCRD are as follows:
| G8Null: | N-terminal CRD* (Met1 - Ser155) + residues corresponding to the NdeI site (HM) + C-terminal CRD (Arg184 - Trp317) |
| G8NT: | N-terminal CRD* (Met1 - Ser155 ) + a part of the linker peptide (Asp156 - Thr168) |
| G8CT: | a part of the linker peptide (Ser171 - Leu183) + C-terminal CRD (Arg184 - Trp317) |
| G8NCRD: | N-terminal CRD* (Met1 - Phe153) |
| G8CCRD: | C- terminal CRD (Arg184 - Trp317) |
* It would be more appropriate to assign (Met1 - Ser155 ) as the N-terminal CRD of G8.
・G9
There are at least three G9 isoforms (splicing isoforms: G9S, G9M, and G9L), which only differ in the linker peptide region. The lengths of the linker peptides are 33, 45, and 72 amino acid residues for G9S, G9M, and G9L, respectively. Although (Thr166 - Thr311) (the amino acid residue numbers are those of G9S) was assumed to be the C-terminal CRD of G9 in a previous paper 10, it would be more appropriate to assign (Pro182 - Thr311) as the CRD considering the three-dimensional structure. The yield of G9 markedly differs among the isoforms. It is difficult to obtain recombinant G9L that is sufficient for general biochemical experiments. The yield of G9M is about 30% of that of G9S, and the linker peptide of G9M is significantly more susceptible to proteolysis than that of G9S (data not shown). The intensity of the stained main band of 30LE* is apparently lower than that of 20LE* (Fig. 6B), similar to the case of G4. It is possible that the protein concentration of 30LE is overestimated. In addition, the formation of SDS-resistant oligomers/polymers (the bands near top of the gel) is observed in several galectin preparations including G9 (refer to the section for G13, G14/PPL13), and this may result in the differences in the stained band intensity.
G9MR65H, G9MR239H, and G9MR65,239H are mutant forms of G9M carrying Arg-to-His mutations analogous to those of G8.
G9Null is a mutant form of G9 lacking a part of the linker peptide and highly resistant to proteolytic degradation 10. Sixteen amino acid residues of the linker peptide exist in G9Null as described above, and an extra two amino acid residues (HM) are also inserted like in the case of G8Null. The yield of G9Null is about two times higher than that of G9S. G9 can exist at relatively high concentrations shortly after elution from lactose-agarose. However, the solution starts to turn cloudy within a few minutes after elution, and most G9 (including G9Null) becomes insoluble after dialysis of the eluate against PBS and other buffers of physiological pH. The maximum concentration of G9Null, which is more soluble than G9S, in PBS is about 400 µg/mL. For that reason, it is possible to raise the yield of G9 by diluting the elution fractions of high G9 concentrations immediately after elution with those of low G9 concentrations, which are normally discarded. However, if the concentration of G9Null is adjusted to 400 µg/mL before dialysis, the concentration of the final preparation becomes significantly lower than this value because insolubilization of G9Null during dialysis occurs even at that concentration. The yield data for G9S and G9Null shown in Table 3 were obtained by using this technique. It is possible to prevent the insolubilization of G9 in the eluate by lowering the pH of both the elution buffer and dialysis buffer 11. Refer to "Supplementary explanation" for purification of G9 under acidic conditions. G9NullR65D/G9NullR211D are mutants analogous to G9MR65H/G9MR239H. Because it is not possible to obtain recombinant proteins carrying an Arg to His mutation (G9NullR65H/G9NullR211H), G9NullR65D/G9NullR211D are used instead.
Although part of the problem associated with wild-type G9, high sensitivity to proteolytic inactivation, has been solved by the development of G9Null, the structural modification has only slightly improved the solubility at physiological pH, another issue with wild-type G9. ssG9 (highly stable and soluble form of G9) has been developed to solve the solubility problem 12. ssG9 having a 10-amino acid deletion and a single amino acid substitution at the remaining linker peptide region of G9Null can stably exist at concentrations higher than 2 mg/mL under physiological pH. The modification has no adverse effect on the protease sensitivity or biological activity of G9Null. Six amino acid residues, HPPYPM (wild-type sequence: HPAYPM), exist between the N- and C-terminal CRD of ssG9, and no extra amino acid residue exists. The cDNA for wild-type G9 contains a BamHI site. The sequence has been modified (GGATCC → GTATCC) in ssG9 cDNA. The structures of G9Null, ssG9, G9NT, G9CT, G9NCRD, and G9CCRD are as follows:
| G9Null: | N-terminal CRD (Met1 - Gln148) + residues corresponding to the NdeI site (HM) + a part of the linker peptide + (Thr166 - Met181) + C-terminal CRD (Pro182 - Thr311) | ssG9: | N-terminal CRD (Met1 - Gln148) + a part of the linker peptide with a modification (HPPYPM) + C-Terminal CRD (Pro182 - Thr311) | G9NT: | N-terminal CRD (Met1 - Gln148) + a part of the linker peptide (Pro149 - Thr167) | G9CT*: | a part of the linker peptide (Ile160 - Met193) + C-terminal CRD (Pro194 - Thr323) | G9NCRD: | N-terminal CRD (Met1 - Gln148) | G9CCRD: | a part of the linker peptide + (Thr166 - Met181) + C-Terminal CRD (Pro182 - Thr311) |
* The amino acid residue numbers of G9M are used for G9CT, and those of G9S are used for other clones.
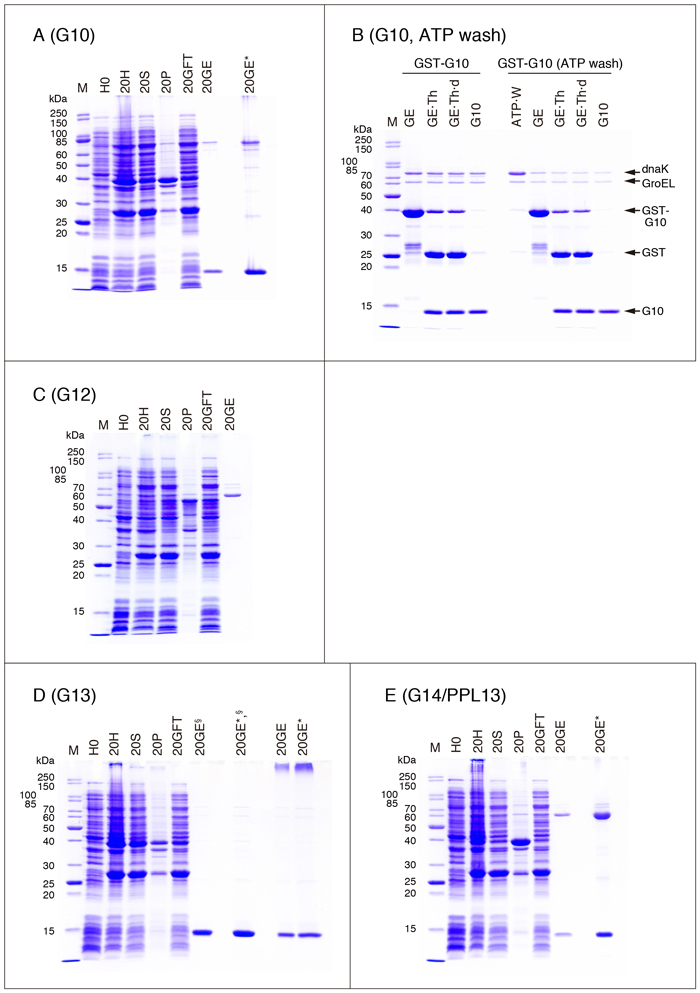
・G10
It is practically impossible to purify G10 by lactose-agarose affinity chromatography.
The purified G10 preparation is concentrated with methanol before the SDS treatment (Fig. 7A, 20GE*). Refer to "Supplementary explanation" for concentration of dilute protein solutions with methanol.
The purified G10 preparation contains E. coli chaperones like G4. The procedure to remove one of the chaperones, DnaK, described in the GST manual is applied to G10 to check the effectiveness of the method (Fig. 7B). In the experiment shown in Fig. 7B, incubation of GST-G10 with ATP is carried out while it is adsorbed to glutathione-Sepharose, although the GST-manual recommends incubation of the E. coli extract with ATP before affinity chromatography. The GST manual also mentions the use of an ATP-immobilized column. In addition, GST-G10 is treated with thrombin after elution from the glutathione-Sepharose column, which is different from the conditions given in Fig. 2. DnaK is released by the incubation with ATP (Fig. 7B ATP·W). The content of DnaK in the purified G10 preparation treated with ATP (the right most lane in Fig. 7B) is apparently lower than that in the untreated preparation. The treatment also has some effect on the content of GroEL.
The experiment shown in Fig. 7B is performed on 2X scale compared to that shown in Fig. 2 until Step 17. The gel is packed into two columns (1 mL gel/column), and then washed as described in Step 19. GST-G10 is eluted from one column (column A) with 50 mM Tris-HCl (pH 8.0), 10 mM glutathione. One mL of ATP solution, 50 mM Tris-HCl (pH 7.5), 2 mM ATP, 10 mM MgCl2 , is added to the other column (column B; the effluent is discarded) and then incubated for 10 min at 37°C. The procedure is repeated three times. The second and third effluents are saved as the ATP-wash fraction. After washing the column with 3 mL of TBS, 0.03% CHAPS, GST-G10 is eluted with 50 mM Tris-HCl (pH 8.0), 10 mM glutathione. The eluate from the column is supplemented with 30 µL of thrombin solution (1 u/µL), and then incubated for 16 h at 25°C, followed by dialysis and centrifugation under the conditions given in Fig. 2 (Step 25 and Step 26). The resulting supernatant is applied to a glutathione-Sepharose column (0.5 mL gel). The non-adsorbed fraction is collected and designated as the purified G10 preparation. Thirty µL of each sample was mixed with 10 µL of SDS sample buffer (4X) and then subjected to heat treatment. The heat-treated samples were analyzed by SDS-PAGE (10 µL/lane).
| GE: | eluate from glutathione-Sepharose with 50 mM Tris-HCl (pH 8.0), 10 mM glutathione | GE·Th: | GE treated with thrombin | GE·Th·d: | supernatant fraction obtained by centrifugation of dialyzed GE·Th | G10: | purified G10 | ATP·W: | ATP-wash fraction (column B) |
・G12
It is practically impossible to obtain recombinant G12, LNG12, G12NT and G12CT in a soluble form using the expression vectors shown in Table 1*. It is most probable that the main band of the purified fraction ( Fig. 7C , 20GE) is GroEL.
G12 (the cDNA insert of pGEX-G12) corresponds to the clone reported by Yang et al. 13. Hotta et al. 14 have reported the presence of an alternative initiation codon in the 5' upstream region of that described by Yang et al. LNG12 corresponds to the latter clone with an N-terminal extension of 22 amino acid residues. Western blot analysis and/or in vitro translation in the presence of radio-labeled methionine are used to detect expressed G12 and LNG12, and no experiment using purified recombinant G12/LNG12 preparation has been conducted. Note that the radio-labeled LNG12 shows low affinity for lactose-agarose 14. The structures of G12NT and G12CT are as follows:
| G12NT: | N-terminal CRD (Met1 - Leu161) + a part of the linker peptide (Asn 162 - Ser 170) |
| G12CT: | a part of the linker peptide (Pro174 - Val188) + C-terminal CRD (Pro189 - Ser314) |
Because the three-dimensional structure of G12 has not been reported except for the results of "in silico analysis", the assignment of CRD and linker regions is tentative.
* Maller et al. 15 have reported the expression and purification of soluble mouse G12 using the pET-28a vector and E. coli host strain Rosseta 2(DE3)pLysS, a BL21 derivative designed to facilitate the expression of eukaryotic proteins. The expression of tRNAs for seven rare codons (AGA, AGG, AUA, CUA, GGA, CCC, and CGG) is enhanced in the strain. Although the mouse G12 expressed by the method has a His-tag, it is not possible to purify the protein with either Ni-NTA carrier or lactose-agarose. The protein is purified by ion-exchange chromatography on Q-Sepharose and CM-Sepharose columns (yield, 5 mg/L culture).
・G13, G14/PPL13
It is practically impossible to purify G13 and G14/PPL13 by lactose-agarose affinity chromatography.
The purified G14/PPL13 preparation is concentrated with methanol before the SDS treatment (Fig. 7E , 20GE*). Refer to "Supplementary explanation" for concentration with methanol. The values for "Protein concentration (mg/mL, A280 nm = 1.0)" in Table 2 and "Purified protein yield " in Table 3 for G14/PPL13 are not reliable because of the presence of a large amount of impurities (provably GroEL) (Fig. 7E).
The samples, 20GE§ and 20GE*,§ , shown in Fig. 7D are not heat-treated before electrophoresis. It is evident that heat treatment of purified G13 in SDS sample buffer results in the formation of SDS-resistant oligomers/polymers (Fig. 7D, 20GE and 20GE*, the bands near top of the gel). A similar phenomenon is observed in the case of G9S etc., but it is not necessarily related to the heat treatment.
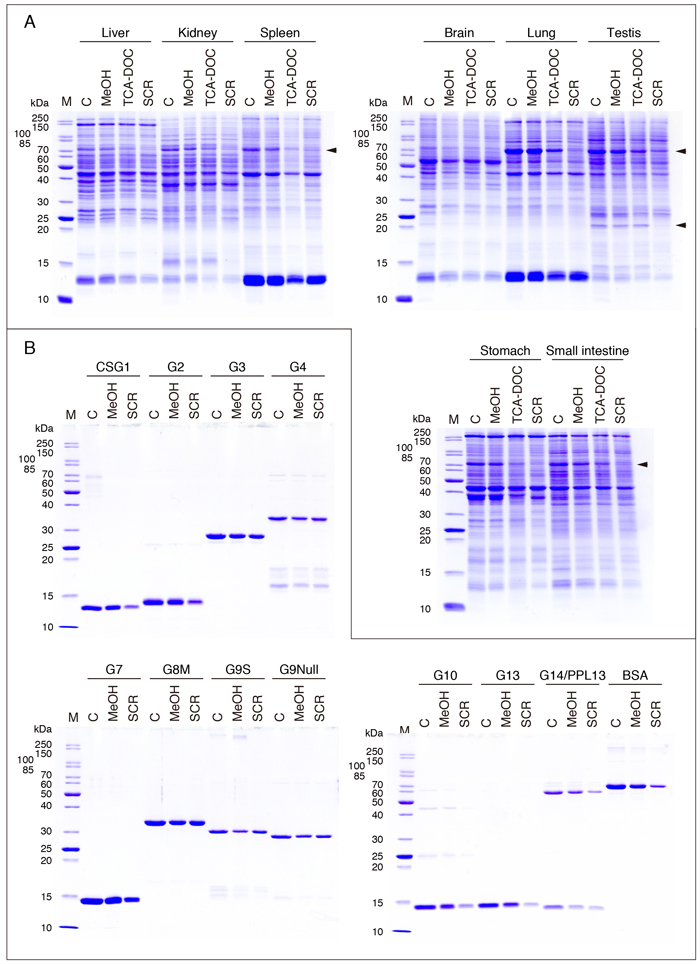
It is usually needed to concentrate and dialyze protein preparations in biochemical research. This is problematic and time-consuming when it is indispensable to preserve their biological activity. On the other hand, it is possible to use more conventional methods for the concentration of dilute protein solutions for SDS-PAGE (Coomassie staining, Western blotting, lectin blotting, etc.). Three concentration methods, including those used for the concentration of purified galectin preparations described above, are described below, though they have no specific relation to the field of galectin research. The three methods comprise the methanol precipitation method, the SCR adsorption method, and the TCA-DOC (trichloroacetic acid-deoxycholic acid) precipitation method (hereinafter referred to as the methanol method, SCR method, and TCA-DOC method). The results with the three methods applied to rat tissue extracts and purified galectin preparations are shown in Fig. 9A and B.
Rat tissue extracts are concentrated by the three methods (Fig. 9A), and purified galectin preparations (and BSA, bovine serum albumin) are concentrated by the methanol method and SCR method (Fig. 9B). The control sample (C) contains 7.5 µg protein/lane and 1 µg protein/lane for Figs. 9A and 9B, respectively. MeOH, TCA-DOC, and SCR indicate the samples concentrated with the methanol method, TAC-DOC method, and SCR method, respectively. The methanol method is best suited for the concentration of rat tissue extracts under the conditions given below. It is evident that some protein bands are not observed at all or observed to only a limited extent with the SCR method (Fig. 9A, arrowheads). Almost the same results are obtained with the galectin preparations: There is only a small difference between the methanol method and SCR method in the recovery of galectins with relatively high molecular weights, i.e., the chimera-type and tandem-repeat-type galectins, while the recovery of the proto-type galectins and BSA is low when the SCR method is used. Although the SCR method is an excellent protein concentration method, care must be taken as to the applicability of the method to the proteins of interest. The effect of priming (see below, "SCR method") on the concentration efficiency of the SCR method is uncertain, because comparative experiments have not been performed. The G4 preparation used for the concentration experiments contains degradation products formed during storage (Fig. 9B). All the G13 samples for SDS-PAGE are not subjected to heat treatment (refer to the section for G13, G14/PPL13).
・Methanol method
This is one of the protein precipitation methods like ammonium sulfate precipitation. In general, the precipitation method is not applicable to dilute protein solutions. The precipitation method is usually used for samples with protein concentrations of higher than 1 mg/mL. The method is intentionally applied to the low concentration protein solutions (rat tissue extracts, 100 µg/mL; galectin solutions, 20 µg/mL) in the experiments shown in Fig. 9. Four times the volume of methanol is added to each sample (final methanol concentration, about 80% [v/v]).
Rat tissue extract (100 µg/mL in TBS), 300 µL in a 2-mL tube
↓ + 1.2 mL of methanol, followed by mixing
↓ 30 min on ice
↓ cent., 14,000 rpm (15,000 xg at Rav), 20 min
Ppt.
↓ residual methanol was removed by an additional brief centrifugation and careful aspiration
↓ dissolved in 40 µL of SDS sample buffer (1X), and then subjected to heat treatment
SDS-PAGE
Galectin solution (20 µg/mL in PBS), 200 µL in a 1.5-mL tube
↓ + 0.8 mL of methanol, followed by mixing
↓ 30 min on ice
↓ cent., 14,000 rpm, 20 min
Ppt.
↓ residual methanol was removed by an additional brief centrifugation and careful aspiration
↓ dissolved in 40 µL of SDS sample buffer (1X), and then subjected to heat treatment
SDS-PAGE
・SCR method
SCR is hydroxylated silica particles originally developed to remove proteins (restriction enzymes, etc.) from DNA solutions in place of the phenol-chloroform extraction method. SCR can also be used for the concentration of dilute protein solutions exploiting the non-specific nature of its protein adsorption. The SCR method, in contrast to the precipitation method, is applicable to dilute protein solutions and takes only a short time. In the protocol below, 10 µL of SCR slurry is added to 300 µL of rat tissue extract (100 µg protein/mL) or 200 µL of purified galectin solution (20 µg protein/mL). The amount of sample (concentration and/or volume) can be increased as long as it is within the adsorption capacity of the SCR used. Like the methanol method, the SCR method can be applied for the preparation of samples mainly for SDS-PAGE and mass spectrometry analyses, in which preservation of biological activity is not needed. It seems difficult to recover proteins adsorbed to SCR in a biologically active form. Since detergents inhibit the interaction between SCR and proteins, care must be taken when applying this method to detergent-containing samples.
Otto et al. have reported a general protocol for the enrichment and storage of proteins using SCR 16. In the protocol, SCR is subjected to "priming" (incubation in hydrochloric acid at 100°C for 6 h) before use. Commercially available SCR without "priming" is used in the experiment below. Note that SCR is a relatively expensive reagent.
Rat tissue extract (100 µg/mL in TBS), 300 µL in a 1.5-mL tube
Galectin solution (20 µg/mL in PBS), 200 µL in a 1.5-mL tube
↓ + 10 µL of SCR slurry (50%[v/v] in H2O)
↓ mixed for 1 min
↓ cent., 30 sec (table top centrifuge)
Ppt.
↓ residual supernatant was removed by an additional brief centrifugation and careful aspiration
↓ suspended in 40 µL of SDS sample buffer (1X), and then subjected to heat treatment
↓ cooled on ice
↓ cent., 30 sec (table top centrifuge)
Sup.
↓
SDS-PAGE
・TCA-DOC method
This method has been developed to determine the protein concentrations of samples containing interfering substances by Lowry's method 17. Although this method is one of the precipitation methods, the use of DOC as a carrier makes it applicable to dilute protein solutions. An additional washing step with methanol is added to the original protocol because TCA is used as a precipitant.
Rat tissue extract (100 µg/mL in TBS), 300 µL
↓ + 300 µL of TBS
↓ + 5 µL of 2% sodium DOC*, followed by mixing
↓ 15 min at room temperature
↓ + 150 µL of 30% TCA, followed by mixing
↓ 15 min on ice
↓ cent., 14,000 rpm (15,000 xg at Rav), 20 min
Ppt.
↓ residual supernatant was removed by an additional brief centrifugation and careful aspiration
↓ + 1 mL of methanol, followed by mixing
↓ cent., 14,000 rpm, 5 min
Ppt.
↓ residual supernatant was removed by an additional brief centrifugation and careful aspiration
↓ dissolved in 40 µL of SDS sample buffer (1X), and then subjected to heat treatment
SDS-PAGE
* The pH of the 2% sodium DOC solution is adjusted to 8.0 - 8.5 with NaOH to facilitate solubilization of sodium DOC. The solution may become cloudy during storage but can be used after through mixing.
The following method was used in this note.
96-well plate, V-bottom (U-bottom)
↓ + 50 µL/well of sample (serially diluted with PBS, 10 mg/mL BSA, 0.05% NaN3)
↓ + 50 µL/well of 2% (v/v) suspension of trypsinized, glutaraldehyde-fixed rabbit erythrocytes
(diluted with PBS, 10 mg/mL BSA, 0.05% NaN3), and then mixed by pipetting several times using a multichannel pipette set at 50 µL
↓ stand for 1 h (2 h) at room temperature
The extent of hemagglutination was observed visually.
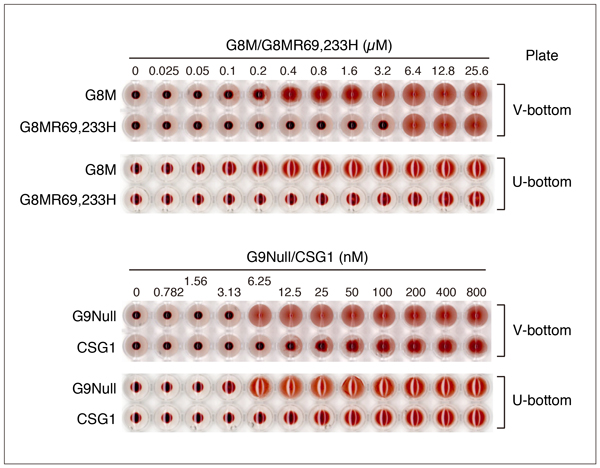
Since hemagglutination is visually evaluated by an appearance of mat formation, it may be difficult to determine the minimum effective concentration depending on the nature of the lectin. In addition, the shape of the plate and the concentration of the erythrocyte suspension may affect the results. Fig. 10 shows the results of hemagglutination assay of G8M, G8MR69,233H, G9Null, and CSG1 using two types of plates. In the case of G9Null, the shape of the plate (V-bottom or U-bottom) does not affect visual judgment of agglutination, while it is difficult in the case of G8MR69,233H when a U-bottom plate is used. Also, the aggregation state changes gradually with increasing concentrations of G8M and CSG1 (especially CSG1) regardless of plate type, making it difficult to unequivocally determine the minimum effective concentration.
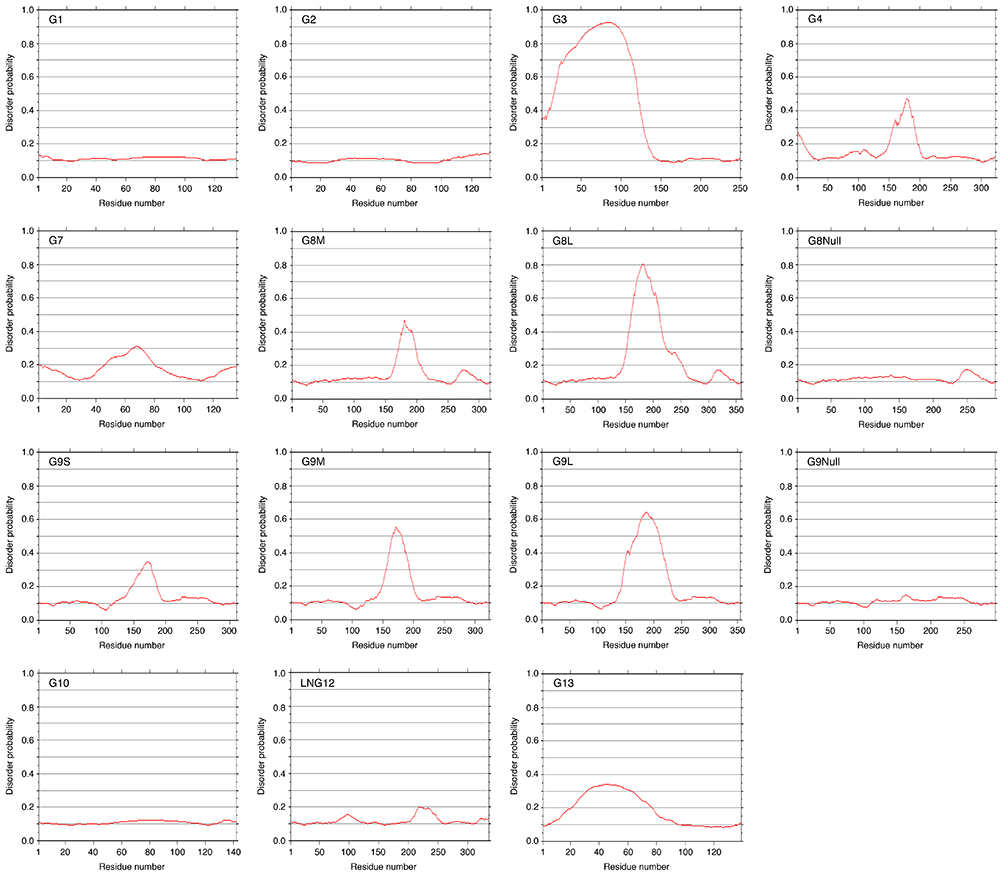
The predicted disordered region of galectins (G1 - G13), which has been obtained by using the Web service of POODLE (Prediction Of Order and Disorder by machine LEarning), is shown in Fig. 11. Although this service is not currently available, it seems possible to perform the analysis on a local PC (Protein Structure Prediction Active Workflow: https://togo.medals.jp/active.html). The N-terminal non-lectin domain of G3 and the linker peptide region of tandem-repeat-type galectins exhibit high disorder probability. There is no typical disordered region in G8Null and G9Null, which lack most part of linker peptide. In the case of LNG12/G12, there is a region with a slightly high disorder probability. However, this region does not correspond to the expected linker peptide. This may have be related to the unusual intracellular localization of the protein: G12 is localized to the inner surface of lipid droplets of 3T3-L1 cells 15. The reason for the presence of regions with relatively high disorder probability in the proto-type galectins, G7 and G13, is unclear.
The yield of G9Null purified under the modified protocol (Step 20 and thereafter of Fig. 1, see below) is as follows (200-mL culture; 20°C, 16 h):
| Acidic conditions*: | 0.708 mg/mL** x 3.85 mL |
| Original conditions*: | 0.385 mg/mL x 5.00 mL |
* The experiments are performed simultaneously for direct comparison.
** The value is calculated on the assumption that the absorption coefficient at 280 nm of G9Null is the same at pH 6.0 as it is at 7.5.
The eluted fractions with high G9Null concentrations are diluted with those with low concentrations in the latter case (original conditions; refer to G9 section) but not in the former case (acidic conditions). This results in differences in the sample volume. A significant amount of precipitate (insolubilized G9Null) is obtained at Step 22 (Fig. 1) under the original conditions. An effort to recover G9Null in a soluble form from the precipitate with an acidic buffer (20 mM Na-Pi (pH 6.0), 0.15 M NaCl, 0.2 M lactose) is not successful (data not shown).
20) Wash the gel with 2 gel-bed volumes of 0.15 M NaCl.
↓
21) Elute the recombinant protein from the gel with 20 mM Na-Pi (pH 6.0), 0.15 M NaCl,
0.2 M lactose.
↓
22) Dialyze the eluate against 20 mM Na-Pi (pH 6.0), 0.15 M NaCl*.
*1st, 4 - 5 h (500 mL); 2nd, overnight (1,000 mL); 3rd, 4 - 5 h (500 mL)
↓
23) Transfer the dialyzed solution to a centrifuge tube, and then spin down the insoluble material
at 25,000 xg for 20 min.
↓
24) Sterilize the supernatant with a sterile filter (0.2 µm).
↓
25) Store the sterilized solution at 4 °C.
I would like to thank Drs. Aiko Itoh (Kagawa University), Takanori Nakamura (Kagawa University), and Jun Hirabayashi (Advanced Industrial Science and Technology) for their valuable cooperation and support for the preparation and publication of this manuscript.
Abbreviations
BSA: bovine serum albumin
CHAPS: 3-[(3-Cholamidopropyl)dimethylammonio]propanesulfonate
CRD: carbohydrate recognition domain
DMSO: dimethylsulfoxide
DOC: deoxycholic acid
DTT: dithiothreitol
FAC: frontal affinity chromatography
G1 - G14: galectin-1 - galectin-14
GST: glutathione S-transferase
IPTG: isopropyl β-D-1-thiogalactopyranoside
Na-Pi: sodium phosphate
PMSF: phenylmethanesulfonyl fluoride (synonym: benzylsulfonyl fluoride, etc.)
SCR: StrataClean Resin
TBS: Tris-buffered saline
TCA: trichloroacetic acid