Kenichi Kasai
I graduated from the Department of Biophysics and Biochemistry, Faculty of Science, The University of Tokyo. After the master course, I became a researcher at the Institute of Physicochemical Biology (Paris, France), then assistant professor and associate professor in the Faculty of Pharmaceutical Sciences, Hokkaido University, and professor in the Faculty of Pharmaceutical Sciences, Teikyo University. Now I am a professor emeritus at Teikyo University. I used to study nuclease and protease, but I detoured into the field of lectin research and was captivated by glycobiology. This new field has removed the scales from my eyes so many times.
A variety of biological processes are controlled through the reading of the glycocode by lectins. However, an elucidation of the mechanism is not easy, because it is based on ambiguous specificity and weak binding. Only a few methods to analyze these interactions have been developed so far. Frontal affinity chromatography (FAC) is a precious research method, which has as its strength the ability to analyze these kinds of interactions. I would like to encourage the use of this method.
Glycans, the third class of bioinformatic molecules, are substantially different in their nature from nucleic acids and proteins, and there are many unresolved issues regarding these molecules 1. Life will never be understood until all the mysteries of glycans are solved. However, these are very challenging. Molecules responsible for decoding information woven into the structure of glycans (glycocode) are known as lectins or other proteins, but it would be extremely difficult to grasp the precise mechanism of the processing of glycan-based information into effects by lectins. The reasons for this are the fuzziness of the process, such as weak binding force and the huge variety of glycans, as well as the scarcity of rigorous analytical methods.
However, there is a unique research method that can overcome this problem: that is, frontal affinity chromatography (FAC) 2-4. This special technique of analyzing weak interactions is not only helpful to investigate informative glycans but also has the potential to elucidate various problems not yet worked on in the life sciences. Nevertheless, the potential is not now widely known. I would like to introduce this technique to broaden its popularity.
Characteristics of biomolecular interactions that most commonly come to mind are strict specificity and strong binding. For example, enzymes, antibodies, and receptors usually recognize only a single partner molecule, and complexes are not easily dissociated once formed. These properties guarantee the robustness and reproducibility of biological responses.
However, my research experience in the area of informative glycans has told me that these commonly held beliefs are just only one aspect of how the biological system responds, and organisms do not depend only on specific and strong molecular interactions to live; fuzzy and weak interactions are also essential.
Glycan-binding proteins generally have low specificity, and their affinity is not very strong. For instance, most of the lectins are “cheaters” who date tens of kinds of glycans. In addition, their affinities are relatively low (dissociation constants are around 10-4 M to 10-6 M), thus they get bored easily and soon break up. However, if you only regard lectins as “coarse” proteins based on these features, that is a superficial view. Such lectin behaviors must have profound meanings (for example, they contribute to life’s flexibility, diversity, and durability). This is an issue to be pursued in depth and in detail. Diverse proteins other than lectins (e.g., part of enzyme inhibitor proteins, growth factors, adhesion proteins, digestive enzymes, annexins, and chaperones) also have glycan binding capacity in addition to their main functions. Probably, these bindings are not just accessory but have some importance, and weak and fuzzy interactions must be frequently viewed in this context. Similar weak interactions may also be widely used in situations other than recognition of glycans.
Progress in the research of weak interactions is very slow because this field draws little attention and also lacks the appropriate research methods. There are many good techniques to measure strong interactions (for example, spectroscopic methods, evanescent light techniques, and calorimetry), but unfortunately, not all of these are suitable for weak interactions. Particularly for glycans, very few techniques are available. The reason for this resides in the measurement principle.
Whatever technique is used, the proportion of formed complexes would be a basic requirement for precise measurement of the affinity. This poses little problem in the measurement of strong interactions, because the proportion of complexes is high even if the concentration of reactive molecules is low. However, in the case of weak interactions, the proportion of complexes is very small, which makes precise measurement difficult.
The rate of complex formation depends on the dissociation constant (Kd) and concentration of reactive molecules. Here we are thinking of a lectin-glycan system as an example. If the concentration of glycan is identical to Kd, 50% of the lectins would be bound to glycans (half saturation). For precise measurement of Kd, experiments must be performed using glycans with concentration close to this condition, but most of the glycans of biological origin are super-rare, and experiments using a 10-4 M-10-6 M solution are far from feasible. Further, many different glycans must be prepared for a single lectin. These dual difficulties cannot be solved at the moment, preventing us from even trying to solvinge this problem.
However, FAC made it possible to overcome this difficulty and analyze weak interactions precisely even with very small amounts of glycans. The reason for this is the uniqueness of its measurement principle, which does not depend on the amount of complex generated. This feature eliminated the necessity for preparing high concentrations of glycans, even for the analysis of weak interactions. If an appropriate technology is developed, the binding force of a single molecule of glycan could be measurable in principle. What made this possible was reverse thinking 2.
Affinity chromatography is one of the strongest tools in existence for isolation and purification in the life sciences. Nevertheless, I gave up on taking advantage of this strength and purposely made a weak affinity adsorbent, which seemed almost useless. This then led to the creation of a great analytical method.
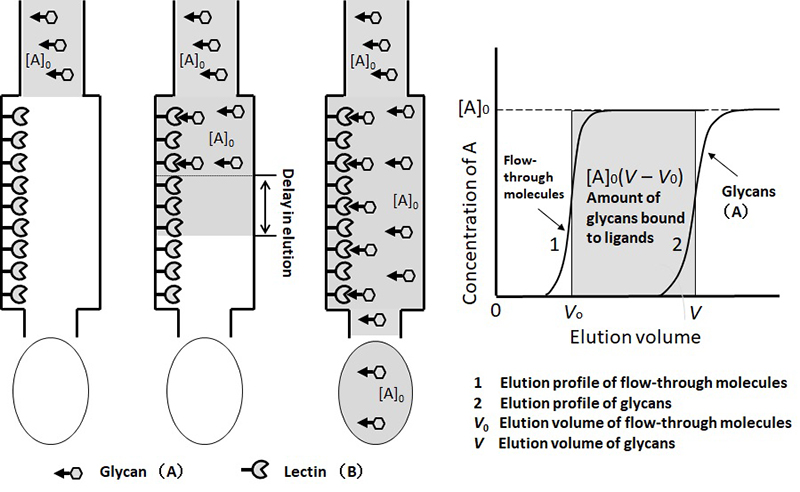
For the analysis of interaction between lectins and glycans using this technique, a relatively small amount of lectin needs to be immobilized deliberately. Glycan solution (analyte) at low concentration poured continuously into the column soon leaks out (Figure 1). The leading edge of the glycan-containing portion has a sigmoidal shape, and the concentration reaches a maximum and then a continuous plateau (Curve 2 in Figure 1). The frontal elution volume (V) can be precisely determined with a simple calculation 5. At the same time, the elution profile of the flow-through substances that do not interact with lectins is also generated as a control (Curve 1 in Figure 1; volume of the frontal elution V0).
As the glycan solution moves through the column, glycan molecules stop every time they interact with immobilized lectins, but if the binding is weak, they disengage and move forward. The frequency of these “detours” depends on two factors: Kd and the density of immobilized lectin in the column (concentration: [B]0). Therefore, the Kd value can be obtained by measuring the delay in the elution of the glycans (V – V0) from the immobilized lectin column using [B]0, which is measured beforehand. This method requires neither the amount of complex to be investigated, nor the concentration of glycans to be increased despite their weak affinity (low concentration is rather preferred for glycans).
The theoretical basis for this will be explained in the Section 5, which is surprisingly simple. This is the history of the birth of an analytic method most suitable for the investigation of weak interactions. (Incidentally, this method is not suitable for the analysis of strong interactions, because the analytes are firmly adsorbed and cannot be moved through.)
FAC determines the elution volume of the front of the analyte solution. This analytical method has a number of benefits and is one of the most effective techniques at the moment. The advantages include 1. clearness of the theory, 2. simplicity of the experimental system, 3. ease in operation, 4. ability to efficiently determine Kd for multiple analytes by continuous measurement, and many other points.
Thanks to these benefits, you only need to prepare a lectin-immobilized column to efficiently generate a list of Kds of many kinds of glycans. From the information obtained, the glycocode recognition profile of the lectin, that is the character of its preferences, would be unveiled. This method provides not just qualitative information (“like” or “dislike”), but high-quality quantitative data such as “x-times higher or lower.”
FAC in its early days was a laborious and time-consuming method, which required a substantial amount of sample. However, technical innovation in many aspects (advances in HPLC equipment, faster data analysis by PC, etc.) and appearance of many types of fluorescent-labeled oligosaccharides of biological origin (pyridylamino [PA]-oligosaccharides) greatly improved its performance 5.
As a result, the experimental system was so miniaturized that you only need to prepare about 1 ml of PA-oligosaccharide solution with concentration of approximately 10 nM, pour this solution into an immobilized lectin column with a minimum volume (100-µl order of magnitude), and generate an elution curve using a fluorescence monitor. It took only about 10 minutes for each sample under continuous flow conditions in which the sample solution and wash solution are introduced into the columns alternately by switching flow channels. Although manual operation is simple and easy, automated devices have been developed, which can analyze tens of kinds of glycans in a day 6.
Up to now, the lectin affinity profiles of about 100 PA-oligosaccharides have already been obtained for more than 100 types of lectins. It has been revealed in detail how each lectin distinguishes different glycocodes and how strong the affinity is. A substantial amount of information has been publicly released (Lectin Frontier Database: LfDB) 7. These data provide a precious basis for interpretation/evaluation of phenomena or experiments involving lectins.
Here I show some examples of how useful this information is.
Diversity of galectins
Galectin is a representative group of animal lectins, and more than 10 types of galectins play some role in human body. However, structures and binding profiles to glycans (at the qualitative level) are similar to each other, and it is unclear how differently they work. FAC has been revealing the details of glycocode recognition for each galectin 8. Mysteries will be solved by collating this information with that on the characteristics of glycans at the site where each galectin actually works.
Lectins involved in the quality control of proteins
Glycocodes present on N-linked glycans are deeply involved in the quality control of proteins, and are recognized by many types of lectins in the endoplasmic reticulum. Affinity profiles of these lectins are useful for further understanding the function of each lectin 9.
Performance evaluation of lectins as research tools
Lectins are used as important tools in glycan research. With the use of lectins of known affinity profile, you can deepen your understanding of the results of your experiments. For example, your application of histochemistry can be enhanced by obtaining a higher-grade information on the glycan structure. Unexpected binding traits of lectins may also be found.
Here, I explain the theoretical basis of FAC. Thanks to frontal analysis, it is very simple.
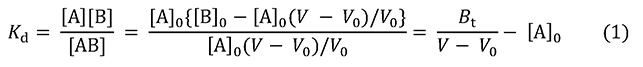
As shown in Figure 1, the elution volume of flow-through molecules is represented as V0. Based on this value, the void volume of the column can be estimated (in affinity adsorbents of which agarose gel is used as a base material, the void volume can be assumed to be almost the same as the volume of the column). Elution volume of analyte (A) is shown as V, where the initial concentration of solution A is [A]0 and the concentration of immobilized ligand (B) is [B]0. The gray square represents the amount of A trapped in the column; the area, [A]0(V – V0), is the amount of A bound to B. A is continuously supplied to the column, thus the concentration of free A represented as [A] is equal to [A]0. If [B] is the concentration of B not bound to A, and [AB] is the concentration of A-B bound complex, then the dissociation constant Kd and the elution state of A can be linked in the form of equation 1.
Bt is the total amount of B in the column, that is, V0[B]0. From this, equation 2 can be derived.
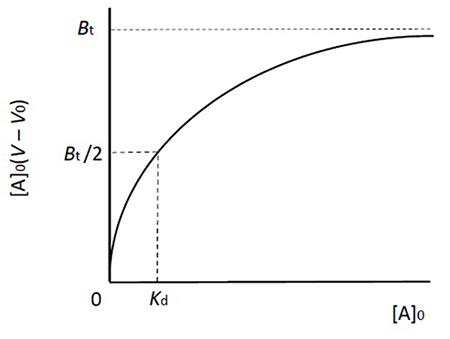
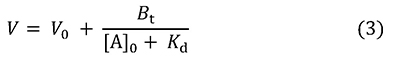
This equation represents the saturation curve for the adsorption equilibrium phenomenon, and its form is the same as the Michaelis-Menten equation for enzyme reactions (Figure 2). The relationship between the amount of B bound to A (left hand of the equation) and [A]0 is represented as a rectangular hyperbola, and its shape is determined by two constants, Kd and Bt (which correspond to Km and Vmax in enzyme reactions). These constants can be obtained in the same manner as in enzyme kinetics (Lineweaver-Burk plot, Woolf-Hofstee plot, etc.). By the way, equation 3 can be also derived from equation 1.
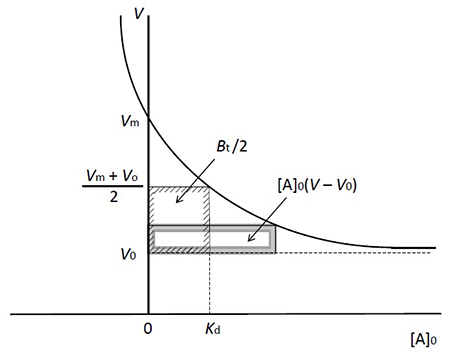
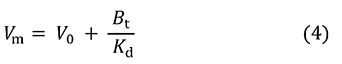
This equation tells us about how V changes with different [A]0 values (Figure 3). As [A]0 increases, the rate of elution of A accelerates and finally reaches V0 (a state in which immobilized ligands are fully saturated). On the other hand, along with the decrease in [A]0, V becomes larger; when [A]0 approaches 0, V gets close to Vm. Then, equation 4 is obtained.
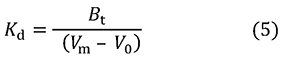
This can be transformed into equation 5, which gives Kd.
This equation does not contain [A]0, which means that if [A]0 is small enough (roughly 1% of Kd or less than that acceptable in actual experiments), there is no need to consider analyte concentration in the measurement of binding affinity. But why? To explain this, I present equation 6, which can be derived from equation 4.
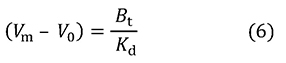
This equation indicates that the delay in elution is inversely proportional to Kd (proportional to association constant Ka), and its proportionality constant is Bt. Further, here we substitute [B]0V0 for Bt and divide both sides by V0. When the concentration of the analyte is extremely low, most immobilized ligands are not bound to analytes, and thus [B]0 can be assumed to be [B], and equation 7 is obtained.
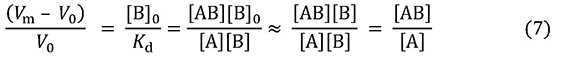
The left hand of the equation represents the number of column volumes that would be equivalent to the delay of A. This is determined by the ratio of [B]0 and Kd. Regarding the rightmost side of the equation, this value is equal to the ratio of the concentration of A captured by immobilized ligands and the concentration of unbound A. Focusing on a single molecule of analyte, this value can also be seen as representing the ratio of the analyte in the state of capture by immobilized ligands and in the state of free flow.
A can move through the column with the eluent only when it is unbound and free. When [AB]/[A] = 1, A is forced to stop every time it takes a forward step. In other words, each molecule has only half chance to move, therefore twice the volume of solution is required to elute it. If [AB]/[A] = 0.1, A is forced to make a stop every time it moves ten steps forward, which causes a delay equal to 10% of V0.
As mentioned above, if [A]0 is set sufficiently lower than Kd, affinity can be obtained only by measuring the delay in elution. However, the Bt of the column must be obtained in advance, by an experiment based on the equation 2 (relationship between saturation and [A]0). This experiment, exceptionally, must be performed using analytes at a concentration of around Kd, thus inexpensive and affordable sugar derivatives (ex. p-nitrophenyl sugar) are used for this measurement. Once Bt is determined, Kd can be measured effectively and continuously using the column, no matter how many glycans need to be analyzed.
From the discussion above, FAC can be performed in two ways, depending on the conditions: 1. when the amount of analyte is excessive, and 2. the amount of immobilized ligand is excessive. In condition 1, as the analytes compete with each other for binding to immobilized ligands, the analytes that fail to bind move faster and V gets smaller as [A]0 becomes larger. By analyzing these parameters using equation 2, Kd and Bt can be calculated. In condition 2, since the amount of analyte is far less than the amount of immobilized ligand available for binding, analytes do not compete each other, and a simple relationship appears: delay in movement is proportional to the association constant (the reciprocal of Kd). These features of FAC are the source of its extraordinary analytical capacity.
A variety of analytical methods relying on movements of molecules, including gel chromatography, SDS-PAGE, and agarose gel electrophoresis, have been essential in today’s life sciences. However, these methods only have an empirical basis and are not supported by established theory. Therefore, these techniques require comparison with the mobility of molecular standards, and also have weaknesses in their reliability (molecular weight of proteins, in particular). In contrast, FAC is a biochemical analytical method based on a new concept, “retardation analysis of interactions between molecules,” which has a theoretical basis.
The use of FAC is still limited to, e.g., interactions between proteins and drugs, screening of protein-binding compounds, interactions between polysialic acid and neurotransmitters, etc. The main reason for this is that researchers have not yet identified suitable applications for this technique. Here, I would like to imagine and suggest a few examples.
Glycocode recognition profiles of glycosaminoglycan-binding proteins
There are a wide range of proteins that recognize the glycocode on glycosaminoglycans, but their recognizable glycocodes are identified by only a few proteins, such as antithrombin and FGF (which have exceptionally strong affinity). If a library for glycosaminoglycan-derived oligosaccharides becomes available, glycocode affinity profiles of these numerous hidden lectins can be accumulated. This information could bring about a great leap in glycosaminoglycan research.
Analysis of interactions between glycolipids
FAC may be applicable to elucidate very weak interactions between glycans on glycolipids. This can be made possible by columns of high-density immobilized glycolipids or glycans.
Interactions between olfactory receptors and odorants
In olfaction, odors in nature (ca. a hundred thousand types) are discriminated from each other with a limited number of olfactory receptors (about 400 types in humans). High resolution of the olfactory function is achieved by the mechanism involving specific odor binding to multiple receptors, and the brain synthesizes these signals (multidimensional analysis). The basis for this mechanism is that each receptor has low specificity (and weak affinity) and capability to respond to multiple odor molecules. This situation is quite similar to the lectins situation, thus FAC may also be suitable in this field.